
Remember me


This was a single center, retrospective study using high fidelity physiologic data. The primary aim of the study was to characterize the change in heart rate, mean arterial blood pressure, central venous pressure, arterial oxygen saturation, respiratory rate, end tidal carbon dioxide, and renal near infrared spectroscopy associated with music therapy. Secondary aims of the study included identifying physiologic response clusters.
The study received institutional review board approval and is in concordance with the Helsinki declaration.
Patient SelectionAll patients admitted to the pediatric cardiac intensive care unit between April 1, 2024, and October 1, 2025, and received music therapy were eligible for inclusion. Patients were excluded if Sickbay data were not available.
Data StreamsPhysiologic data were collected using the Sickbay platform (Medical Informatics Corporation, Houston, TX). Data were aggregated in Sickbay at a temporal resolution of 1-second. Heart rate was sourced from the telemetry in beats per minute, mean arterial blood pressure was sourced from an arterial line if available otherwise from a noninvasive blood pressure cuff in mmHg, central venous pressure from a central venous catheter (generally femoral) in mmHg, arterial oxygen saturation from a pulse oximeter in %, respiratory rate from a pulse oximeter in respirations per minute, end tidal carbon dioxide from an inline monitor in mmHg, and renal near infrared spectroscopy using an INVOS 5100 monitor (Medtronic, Dublin, Ireland) in %.
Demographic and clinical data such as age, circulatory physiology, mechanical ventilation, mechanical circulatory support, sedation, and vasoactive inotrope score were collected from the electronic health record.
The following data were collected from the music therapy documentation directly pertaining to the therapy: start time, end time, participation level (fully engaged, partially engaged, not engaged), music therapy techniques utilized (active, receptive, or both), and whether or not they were dancing/clapping/singing/playing an instrument during music therapy (Tables 1 and 2).
Table 1 Results of adjusted multivariable models for each physiologic variableRelative TimeData were collected for each music therapy session. Data were collected for an hour prior to the start of music therapy and four hours after the start of music therapy. A relative time field was created with 1-second intervals with the start time of that session serving as time zero. Any data collected for a time prior to start of music therapy was assigned a negative relative time any data collected for a time after start of music therapy a positive relative time (Figs. 1, 2, 3 and 4).
Fig. 1 Fig. 2
 Fig. 3
 Fig. 4
 Music Therapy
Music therapy sessions in the pediatric cardiac intensive care unit are individualized to the unique needs of each patient and family. As such, the goals for sessions are informed by the indications for referral and by the music therapist’s initial assessment, and they can change if needed over the course of patients’ admissions (Figs. 5, 6 and 7).
Fig. 5 Fig. 6
 Fig. 7
Music therapy sessions all began with a musical opening to transition patients into the session. This consisted of a hello song or a musical grounding exercise. Following the musical opening, various music interventions were implemented and sequenced during the session based on the patient’s needs and current medical status. For instance, an active toddler with full mobility would usually experience sequencing gross motor movement experiences to active music-making with instruments. An adolescent with limited mobility experiencing anxiety about an upcoming procedure was more likely to receive musical grounding to music assisted relaxation. The music therapist observed patient response to adjust the experiences and their sequencing to ensure that patient safety and comfort was prioritized. For instance, if a patient began to experience tachycardia and respiratory distress during a music experience, the tempo of the music would be changed. Sessions were ended with a musical closing to transition patients out of the session. Like the musical opening, these included a goodbye song or musical grounding exercise.
When complete, sessions were documented in the patient’s electronic medical record and include the following information: patient’s level of engagement, music interventions utilized, patient’s physiological outcomes, goals, and a narrative description of session.
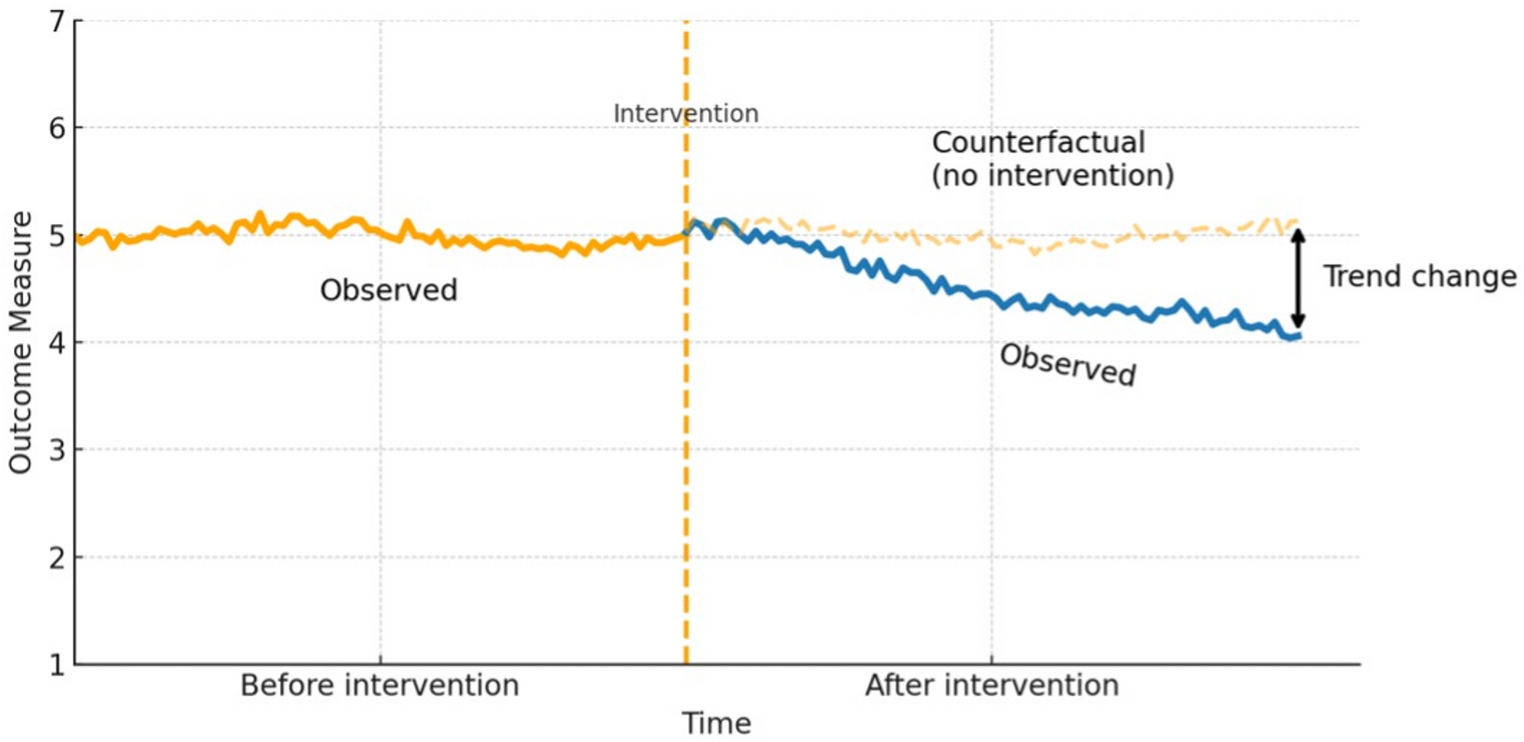
Statistical Analyses, PlottingTo visualize physiologic trajectories surrounding the initiation of music therapy, locally estimated scatterplot smoothing plots were constructed for each physiologic variable using relative time in hours on the x-axis and percent change from baseline on the y-axis. For each variable, the mean and 95% confidence interval were plotted. Smoothing bandwidths were chosen to balance local fidelity and global trend stability.
Statistical Analyses, Mixed Effects ModelingNext, to evaluate the independent association of music therapy with physiologic change, multivariable linear mixed-effects models were fit. The following dependent variables were modeled: percent change in heart rate, percent change in mean arterial blood pressure, percent change in central venous pressure, percent change in arterial oxygen saturation, percent change in respiratory rate, percent change in end tidal carbon dioxide, and percent change in renal near infrared spectroscopy. The following were included as fixed effects: participation level, music therapy technique, whether the patient was dancing/singing/playing an instrument, receiving invasive mechanical ventilation, receiving mechanical circulatory support, circulatory physiology, age, receiving sedation, and vasoactive inotrope score. The patient was included as a random intercept to account for repeated measures. When the mixed-effects model failed to converge, a cluster-robust ordinary least squares model was used to adjust for within-patient correlation. False discovery rate correction was used to control for multiple comparisons across physiologic outcomes. Median imputation was used for missing data. Only data from during (relative time 0 to the end of the sessions) music therapy were included for this model. Data from periods before and after the music therapy session were not included. It is important to note that the R-squared values reported for the models do not represent model quality. These R-squared values represent the amount of the variance in the dependent variable explained by the included covariates. For instance, an R-squared value of 0.20 does not indicate a poorly performing model, it indicates the model explains 20% of the variance in the dependent variable.
It is important to note that the locally estimated scatterplot smoothing plots plot the raw values without adjusting for any covariables. The mixed-effects modeling adjusted for other covariables and only included data from before and during music therapy, not after. This approach allowed the plots to provide a general sense of what happens over a larger time period and allowed the mixed-effects models to characterize what happens specifically during music therapy.
Statistical Analyses, Random Forest Cluster AnalysisNext, to identify distinct physiology response phenotypes, an unsupervised random forest embedding was conducted with percent changes in heart rate, mean arterial blood pressure, central venous pressure, arterial oxygen saturation, respiratory rate, end tidal carbon dioxide, and near infrared spectroscopy. Each variable was median-imputed and scaled with a robust scaler. A 500-tree embedding generated a dissimilarity matrix, which was projected to a 20-dimensional embedding using truncated singular-value decomposition. K-means and Ward’s agglomerative clustering algorithms were each evaluated for 2 to 6 clusters, and the optimal model was selected based on the highest silhouette score. Cluster membership, physiologic summaries, and patient counts were reported. Clinical covariates were compared between clusters using Mann-Whitney U tests for continuous variables and Fisher’s exact tests for categorical variables.
All analyses were performed in a local Python environment using Python 3.10. The pandas, statsmodels, scikit-learn, and matplotlib libraries were used. A p-value of less than 0.05 was considered statistically significant. Any use of the word “significant”, “significantly”, or “significance” in this manuscript will refer to statistical significance unless explicitly stated to be clinical significance.
Comments (0)