
Remember me


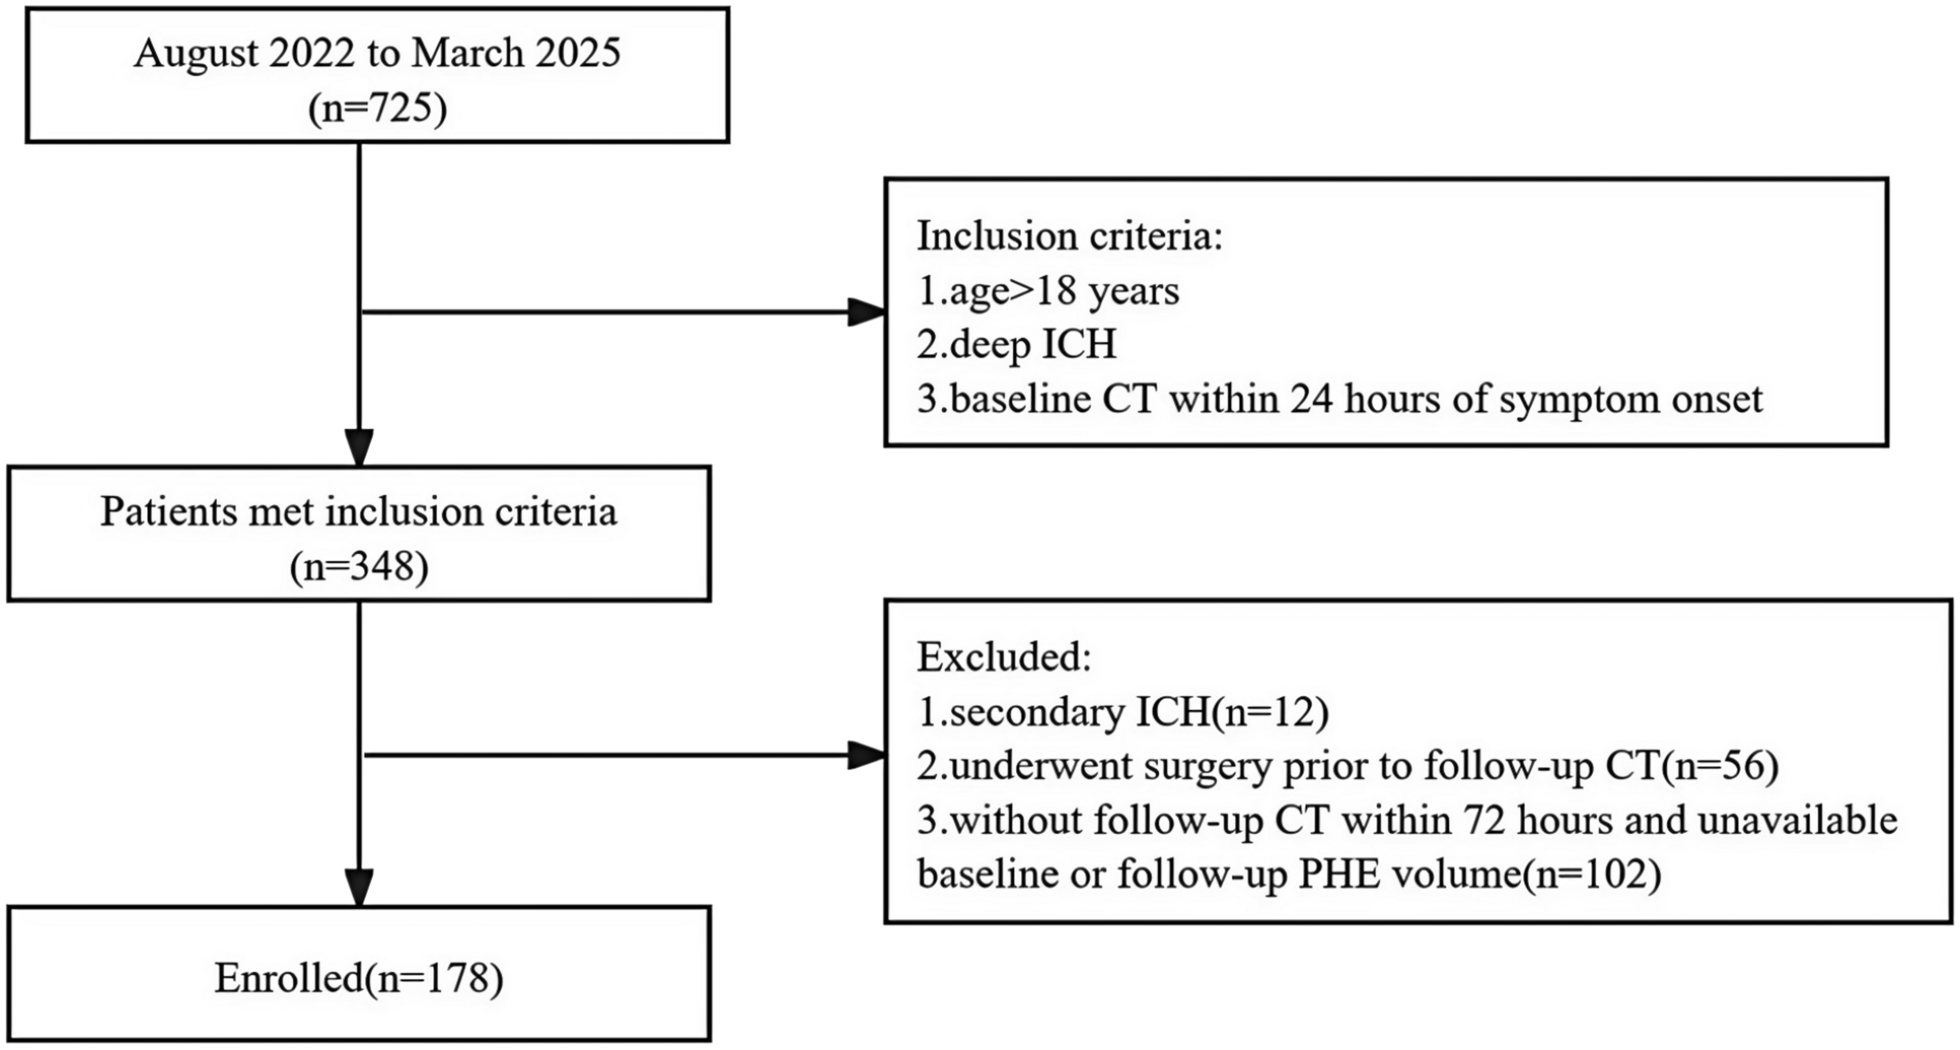


The inclusion and exclusion criteria for this study are detailed in Fig. 1. A cohort of 132 patients diagnosed with spontaneous intracerebral hemorrhage (sICH) was recruited for this investigation. The median age of the participants was 59 years, with an interquartile range (IQR) of 51–70.25 years, and the sample comprised 92 males, representing 69.7% of the total. A significant proportion of the patients with sICH, specifically 93 individuals (70.45%), had a history of hypertension. The mean systolic blood pressure (SBP) and mean arterial pressure (MAP) recorded for the cohort were elevated, measuring 165.9 ± 26.63 mmHg and 120.43 ± 19.41 mmHg, respectively. Upon admission, the Glasgow Coma Scale (GCS) scores varied from 3 to 15, with a median score of 11 and an IQR of 8–13. The Original Intracerebral Hemorrhage (OICH) score at admission had a median value of 2, with an IQR of 1–3. The baseline hematoma volume was characterized by a median of 15.89 ml and an IQR of 8–39.5 ml. The majority of hematomas were located in the deep gray matter (87 cases, 66.41%), followed by lobar (27 cases, 20.61%) and infratentorial (17 cases, 12.98%) regions, with 61 patients (46.21%) presenting with intraventricular hemorrhage. Enhanced CT scans indicated that 50% of the hematomas (66 cases) exhibited the spot sign. Upon admission, the FXIII levels in the majority of patients were significantly lower than the reference threshold of 20 mg/L, with a median [IQR] of 9.81 [7.88, 18.1] mg/L (Table 1).
Fig. 1 The alternative text for this image may have been generated using AI.
Study flowchart. CT, computed tomography; sICH, spontaneous intracerebral hemorrhage; CAA, cerebral amyloid angiopathy
Table 1 Baseline characteristics of patients with sICH with vs without hematoma expansion (HE)In this study, we initially conducted a univariate analysis to compare baseline characteristics and variables between patients with and without HE. Following this, a backward stepwise logistic regression was utilized. Variables that exhibited a significance level of p < 0.1 in the univariate analysis were included to identify those independently associated with HE. As a result, age, hypertension, GCS score, D-dimer levels, the presence of a Spot Sign, and FXIII levels were included in the multivariable analysis. Hematoma volume was excluded from the multivariable model due to its lack of significant difference in the univariate analysis.
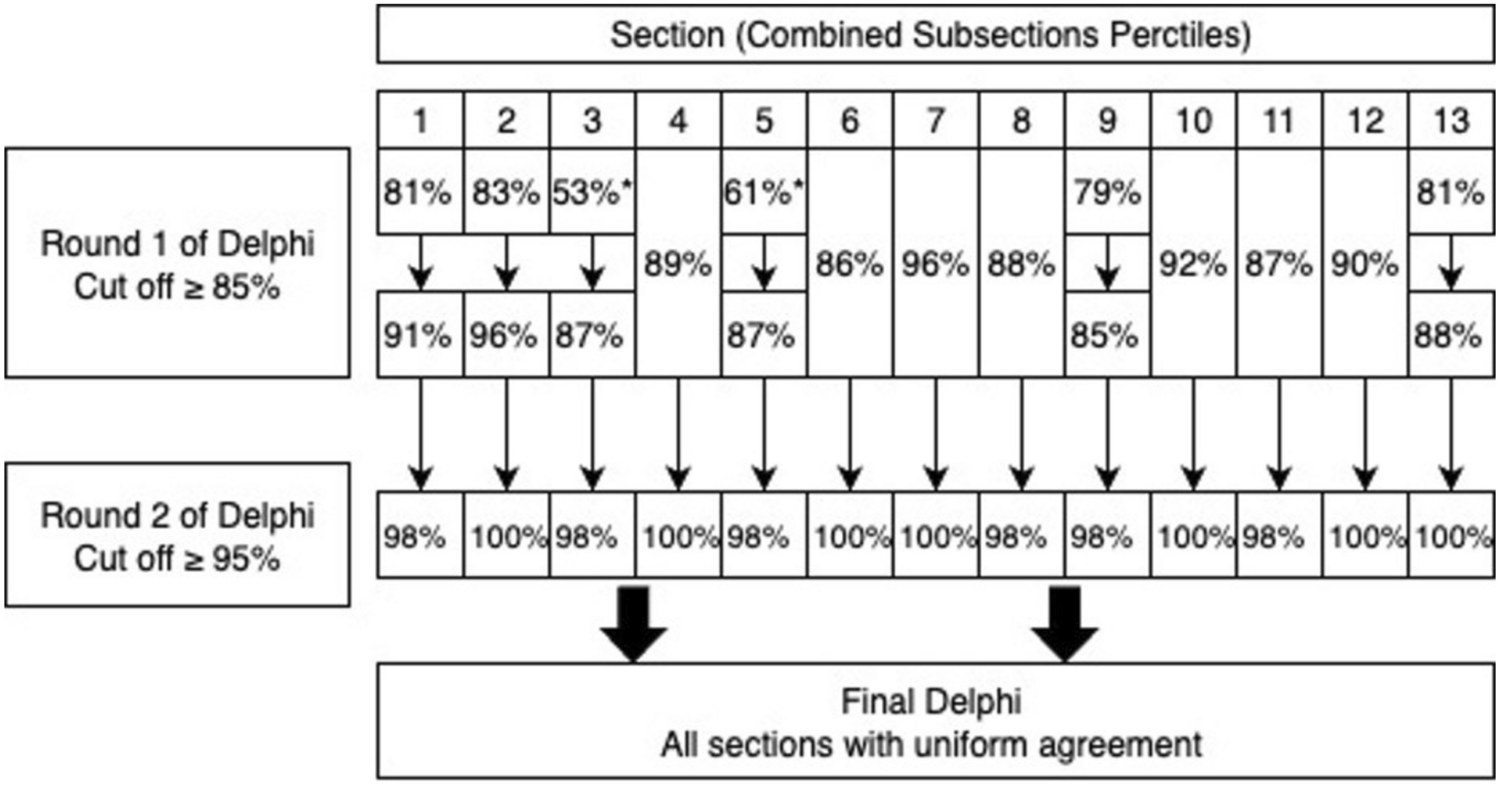
Hematoma ExpansionHematoma expansion (HE) was observed in 39 (29.5%) of the 132 patients enrolled with sICH. Patients with HE exhibited significantly lower admission levels of FXIII, with a median [IQR] of 8.21 [6.33, 10.37] mg/L, compared with non-HE patients with sICH, who had a median [IQR] of 11.68 [8.49–21.20] mg/L (p < 0.001). Among the 39 patients with HE, 29 (76%) tested positive for the spot sign (p < 0.001) (Table 1). Nonlinear analysis revealed an inverse correlation between admission FXIII levels and the risk of HE, with this trend being most pronounced at FXIII levels of 10 mg/L (Fig. 2). Analysis of continuous variables indicated that both FXIII levels (OR = 0.83; 95% CI, 0.76–0.914; p < 0.001) and the presence of the spot sign (OR = 6.16; 95% CI, 2.465–15.373; p < 0.001) were significantly associated with HE. Multivariable logistic regression analysis, with FXIII dichotomized at 10 mg/L, further highlighted this trend: patients with FXIII levels below 10 mg/L had a fivefold increased likelihood of experiencing HE compared with those with levels above 10 mg/L (OR = 5; 95% CI, 2.031–12.325; p < 0.001) (Table 2).
Fig. 2 The alternative text for this image may have been generated using AI.
The shape of the relationship between the FXIII levels at admission and hematoma expansion (HE) risk. When FXIII levels < 10 mg/L, the risk of HE increases progressively with declining FXIII levels
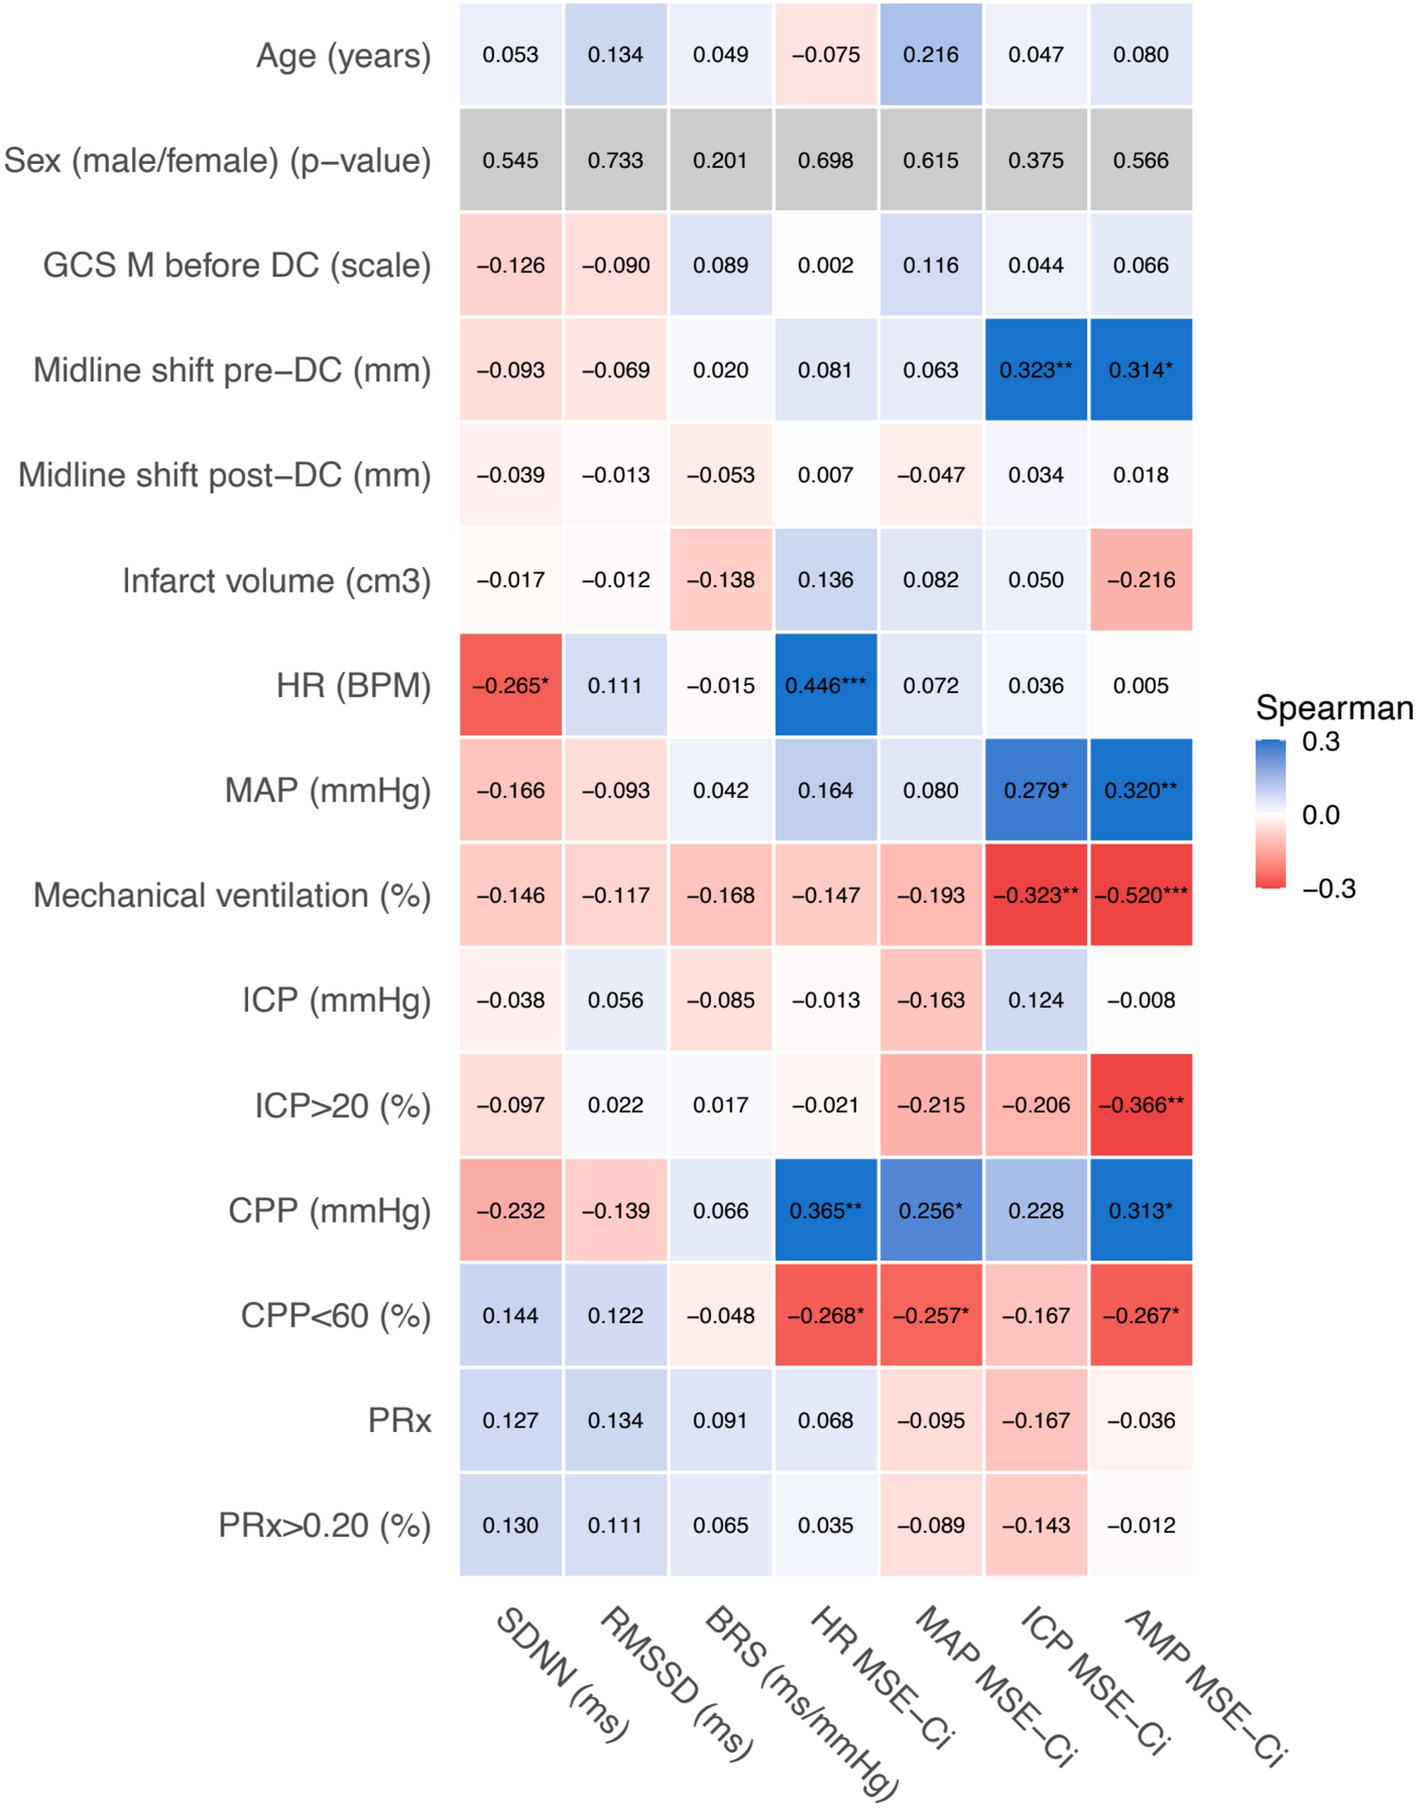
Table 2 Correlation between FXIII levels and hematoma expansion (HE)MortalityThe admission GCS scores demonstrated a statistically significant difference between survivors and nonsurvivors, with median [IQR] of 11 [9, 13] and 7 [4, 10], respectively (p < 0.001). Similarly, the OICH scores exhibited a pronounced disparity, with survivors having median [IQR] of 1 [1, 2] compared to 3 [2, 4] in nonsurvivors (p < 0.001). Admission glucose levels also showed significant differences between the groups, with survivors having median levels [IQR] of 7.6 [6.55, 9.1] mmol/L, whereas nonsurvivors had 9.3 [8, 12.1] mmol/L (p < 0.001). Furthermore, baseline hematoma volumes were significantly lower in survivors, with a median [IQR] of 14.22 [8–31.5] ml, compared with 49 [13.54–74] ml in nonsurvivors (p < 0.001). FXIII levels were notably higher in survivors, with a median [IQR] of 11.68 [8.54–19.15] mg/L, as opposed to 7.13 [5.95–8.34] mg/L in nonsurvivors (p < 0.001). Further analysis indicated that among deceased patients, over 93% had FXIII levels < 10 mg/L (n = 27, 93.1%; p < 0.001), whereas only approximately 40% of surviving patients exhibited FXIII levels < 10 mg/L (n = 42, 40.78%; p < 0.001) (Supplementary Table 1). The investigation into the nonlinear association between FXIII levels and patient mortality demonstrated that FXIII concentrations below the 10 mg/L threshold were linked to a marked increase in mortality rates (Fig. 3). In multivariate logistic regression analyses treating FXIII as a continuous variable, a decline in FXIII levels was significantly correlated with heightened patient mortality (OR = 0.84; 95% CI, 0.737–0.959; p = 0.009). Additionally, both the Glasgow Coma Scale (GCS) score and glucose levels were found to be significantly associated with mortality, with odds ratios of 0.79 (95% CI, 0.679–0.929; p = 0.004) and 1.28 (95% CI, 1.051–1.568; p = 0.014), respectively. Furthermore, when FXIII levels were dichotomized at the 10 mg/L threshold in multivariable logistic regression models, individuals with FXIII levels < 10 mg/L exhibited a 12.07-fold increased risk of mortality (OR = 12.07; 95% CI, 2.526–57.669; p = 0.002). The associations of GCS score and glucose levels with mortality remained significant across both patient cohorts stratified by the FXIII cutoff of 10 mg/L, with odds ratios of 0.8 (95% CI, 0.685–0.944; p = 0.008) and 1.27 (95% CI, 1.05–1.542; p = 0.014), respectively (Table 3).
Fig. 3 The alternative text for this image may have been generated using AI.
The shape of the relationship between the FXIII levels and mortality. When FXIII levels falls 10 mg/L, patient mortality increases demonstrably with further decline in FXIII levels
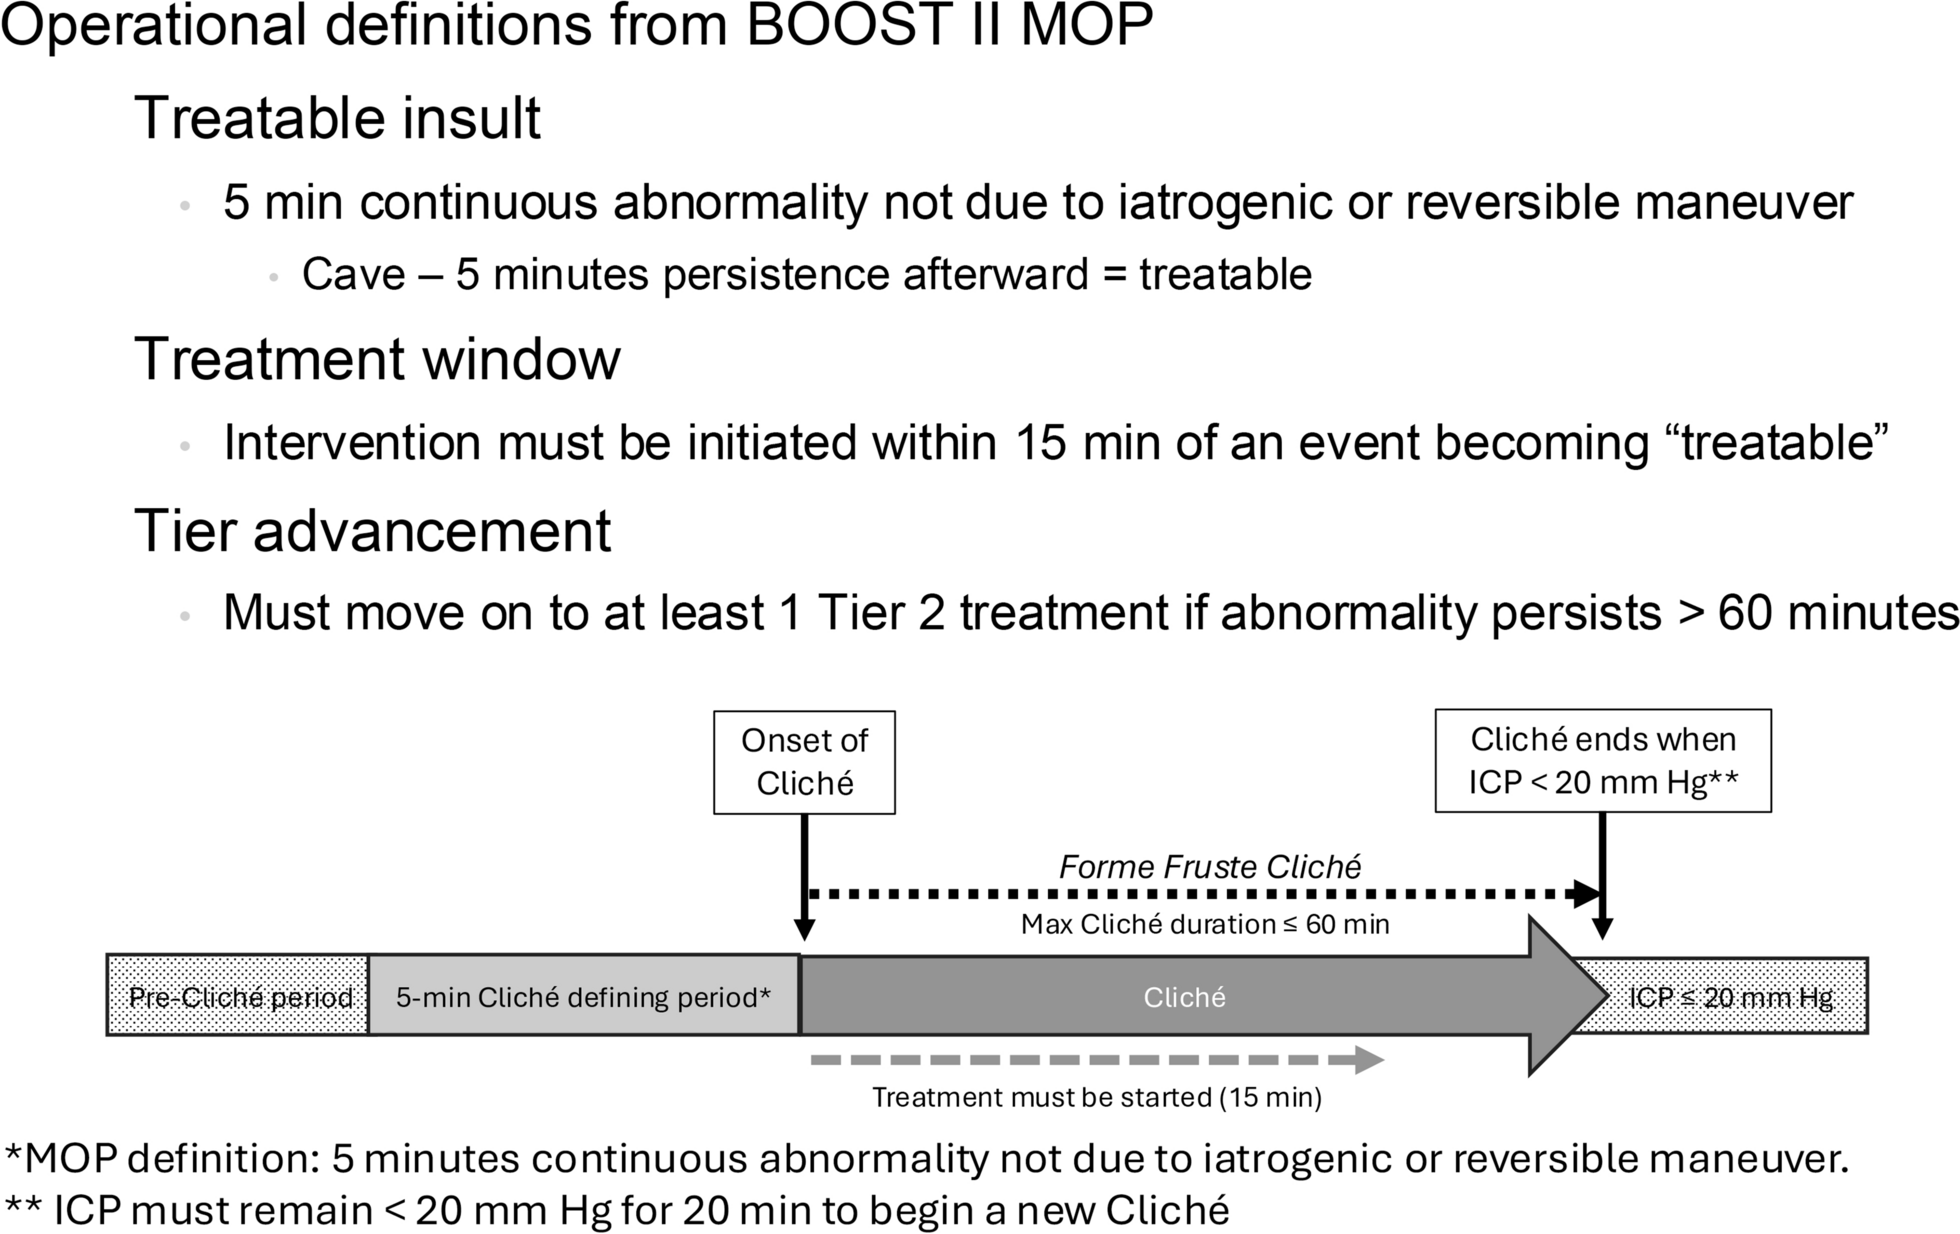
Table 3 Correlation between FXIII levels and mortality90-Day Functional OutcomeIn this study, 73.48% of patients exhibited unfavorable functional outcomes, defined as a modified Rankin Scale (mRS) score of 3 or higher (n = 97). Patients who achieved favorable outcomes (mRS < 2) presented with significantly higher Glasgow Coma Scale (GCS) scores upon admission compared with those with poor outcomes, with a median [IQR] of 14 [12.5–14.5] versus 10 [7,8,9,10,11,12], respectively (p < 0.001). Similarly, the OICH score exhibited a consistent pattern, with patients experiencing unfavorable outcomes having higher OICH scores than those with favorable outcomes, reflected by a median OICH [IQR] of 2 [1,2,3] versus 1 [1, 2] (p < 0.001). In examining the influence of FXIII levels on patient prognosis, the group with favorable outcomes demonstrated a significantly higher median FXIII [IQR] of 22.18 [18.08, 26.69] mg/L, compared with 9.00 [7.13, 11.09] mg/L in the group with unfavorable outcomes (p < 0.001). This positive correlation persisted when patients were stratified by predefined FXIII thresholds: among the 97 patients with unfavorable functional outcomes, over 70% had FXIII levels < 10 mg/L, whereas only 2.86% of the favorable outcomes group exhibited FXIII levels < 10 mg/L (p < 0.001) (Supplementary Table 2). Furthermore, analysis of the nonlinear relationship between admission FXIII levels and mRS indicated that as FXIII levels increased, there was a corresponding decline in mRS scores (Fig. 4). The analysis of continuous variables identified FXIII levels (OR = 0.74; 95% CI, 0.66–0.839; p < 0.001), D-dimer (OR = 2.43; 95% CI, 1.342–4.385; p = 0.003), and GCS (OR = 0.5; 95% CI, 0.352–0.707; p < 0.001) as factors significantly associated with patient functional outcomes. This relationship was further intensified in the multivariable logistic regression analysis for the mRS when FXIII was dichotomized at 10 mg/L. Specifically, patients with FXIII levels below 10 mg/L demonstrated a 59.45-fold increased risk of poor functional outcomes (mRS > 3) compared with those with FXIII levels above 10 mg/L (OR = 59.45; 95% CI, 7.258–487.006; p < 0.001) (Table 4).
Fig. 4 The alternative text for this image may have been generated using AI.
The shape of the relationship between the FXIII levels and unfavorable functional outcome (mRS) prediction. Elevated FXIII levels correlate with reduced mRS scores and increased probability of favorable functional outcomes. mRS, modified Rankin Scale
Table 4 Correlation between FXIII levels and functional outcome (mRS)
Comments (0)