
Remember me



The relative peak areas of PFBA (50 ng/L) under different salt concentrations (i.e., NaCl or CaCl2) are shown in Fig. 1a. Under salt-free conditions, PFBA produced only a weak and broad signal at approximately 10.05 min, which was too low for reliable quantification (Fig. S1a and S1b). When NaCl was added, a sharp and symmetric peak appeared at approximately 9.0 min, with the relative peak area increasing from 100% at 10 mg/L to 105.5% at 20 mg/L before plateauing at 105.3% at 30 mg/L (normalized to NaCl 10 mg/L). Within the tested range, the effect of increasing NaCl concentration became minimal above 20 mg/L. The retention time varied by less than ± 0.03 min across all the conditions, indicating that NaCl primarily influenced signal intensity rather than chromatographic retention.
Fig. 1
Relative peak areas of a PFBA and b 13C4-PFBA under varying NaCl and CaCl2 concentrations (10–30 mg/L), normalized to the respective 10 mg/L condition. Error bars represent standard deviation (n = 3). Relative peak areas were normalized to the corresponding 10 mg/L salt condition because PFBA was not reliably quantifiable under salt-free conditions
Similar trends were observed with CaCl2 (Fig. 1a). The relative peak area increased from 100% at 10 mg/L CaCl2 to 106.3% and 108.9% at 20 and 30 mg/L, respectively (normalized to CaCl2 10 mg/L). Because NaCl and CaCl2 were dosed on a mass concentration basis (mg/L), the corresponding molar concentrations and ionic strengths differed: 10–30 mg/L NaCl corresponds to approximately 0.17–0.51 mM (ionic strength: 0.17–0.51 mM), whereas 10–30 mg/L CaCl2 corresponds to approximately 0.09–0.27 mM (ionic strength: 0.27–0.81 mM). At approximately equivalent molar concentrations (NaCl 10 mg/L, ~ 0.17 mM; CaCl2 20 mg/L, ~ 0.18 mM), PFBA peak areas were comparable, indicating that the lower response observed for CaCl2 at equal mg/L is primarily explained by its lower molar concentration rather than a salt-type specific effect. Similarly, at approximately equivalent ionic strengths (NaCl 30 mg/L, ionic strength ~ 0.51 mM; CaCl2 20 mg/L, ionic strength ~ 0.54 mM), PFBA responses remained comparable with slightly higher responses observed under NaCl, suggesting that ionic strength alone may not fully explain the response difference between the two salts and that factors associated with cation identity could also contribute to the observed differences. The divergent responses observed for longer-chain compounds such as PFOS are discussed further in the context of cation valency and interfacial PFAS behavior in the Discussion section.
The isotopically labeled internal standard, 13C4-PFBA (25 ng/L), showed a similar trend to native PFBA (Fig. 1b). Its peak consistently appeared at 8.97–9.00 min (Fig. S1c and S1d), and the peak area remained within a narrow range of 100–107% (NaCl) and 100–103% (CaCl2) relative to the respective 10 mg/L condition, regardless of salt type or concentration. This stability indicates that analytical variability within each condition remained low throughout the measurements, supporting the reproducibility and reliability of the analytic procedure.
The PFBA/13C4-PFBA area ratio increased systematically from 1.67 to 1.89 across all six salt-added conditions, with within-condition RSD values of 0.4–1.7% (n = 3, Table S2), demonstrating that native PFBA responded more strongly to salt addition than its isotopically labeled analog. Notably, under salt-free conditions, neither native PFBA nor its isotopically labeled analog produced a quantifiable signal, making internal standard correction impossible under the reference condition entirely—a situation not encountered with any other target compound. The systematic ratio increases upon salt addition, combined with low within-condition RSD values, confirms that this differential response is a genuine and reproducible analytical phenomenon that is consistent with the chain-length-dependent sensitivity to ionic strength changes.
Additional experiments were performed using five alternative SPE loading solvent compositions that varied in ammonium acetate concentration and organic solvent type (methanol or acetonitrile) to investigate whether the divergent response observed between native PFBA and 13C4-PFBA originated from suboptimal chromatographic conditions at NaCl and CaCl2 concentrations of 20 mg/L (Table S3). Because PFBA and 13C4-PFBA were analyzed at 50 and 25 ng/L, respectively, we report both the raw PFBA/13C4-PFBA peak-area ratio and the concentration-normalized relative response factor [(native peak area/native concentration)/(IS peak area/IS concentration)], the latter being closer to unity when native and labeled compounds respond comparably. Under the original condition, the normalized response factor remained closest to unity among all conditions tested. Among methanol-based alternatives, 10 mM ammonium acetate yielded a response factor closer to unity under NaCl than the 5 mM condition, but neither matched the original condition. Under CaCl2-containing conditions, none of the alternative loading solvents yielded quantifiable PFBA peaks, and these conditions could therefore not be used to improve or validate the native/labeled agreement; this indicates that CaCl2-containing matrices impose a particularly severe limitation on PFBA quantification under the tested loading-solvent conditions. Taken together, these results show that the discrepancy was not corrected by the tested loading-solvent modifications. However, because the present optimization experiment does not independently isolate SPE retention from ESI ionization, we describe this behavior as a method-specific limitation of 13C4-PFBA compensation rather than as definitive evidence for a specific Ca2+–13C4-PFBA interaction.
It should be noted that the salt-dependent response changes reported in this study represent the net analytical outcome of the online SPE–LC–MS/MS workflow as a whole. Residual inorganic ions may influence PFAS quantification at multiple stages, including analyte retention and breakthrough during SPE loading, desorption behavior during elution, ion-pairing or competitive interactions, and electrospray ionization efficiency. The retention time stability of PFBA (± 0.03 min across all conditions) suggests that chromatographic retention after SPE transfer was not substantially altered by salt addition. However, the divergent response between native PFBA and 13C4-PFBA—the former showing pronounced signal enhancement while the latter remained comparatively stable—implies that a purely ESI-based mechanism is insufficient to account for the full effect, as a uniform ionization shift would be expected to affect both compounds similarly. Therefore, the reported enhancement and suppression values should be interpreted as the integrated response of the full automated workflow.
Electrostatic interactions between residual inorganic ions and anionic PFAS head groups represent the most plausible overarching explanation. At the SPE loading stage, compression of the electrical double layer may reduce electrostatic repulsion between PFAS head groups and the sorbent surface, improving retention and recovery [9], while salting-out effects may further promote partitioning to the sorbent surface [35]. At the ESI stage, PFAS preferentially reside at the surface of electrospray droplets because of their amphiphilic character [36], and moderate electrolyte addition is consistent with enhanced analyte surface partitioning and ionization response [29, 30, 37]. Critically, such electrostatic interactions may simultaneously influence all of these stages, providing a unified explanation for the chain-length-dependent response patterns and the divergent behavior observed between NaCl and CaCl2 conditions, as divalent cations are known to engage in stronger bridging interactions with PFAS head groups than monovalent cations [9, 35, 38, 39].
Detection limits and method performanceThe LODs and LOQs for PFBA under each salt condition are summarized in Table 1. Without added salt, PFBA did not produce a distinct chromatographic peak, and the LOD and LOQ could not be determined. After salt addition, both metrics improved substantially. For NaCl, the LOD decreased from 0.47 ng/L at 10 mg/L to 0.19 ng/L at 20 mg/L and remained at 0.22 ng/L at 30 mg/L. Similarly, the LOQs decreased from 1.56 ng/L at 10 mg/L to 0.62–0.73 ng/L at 20–30 mg/L. CaCl2 showed comparable trends, with LOD values of 0.49 ng/L at 10 mg/L and 0.17–0.22 ng/L at 20–30 mg/L, and the LOQ decreased from 1.62 ng/L at 10 mg/L to 0.57–0.74 ng/L at 20–30 mg/L.
Table 1 LODs and LOQs of PFBA under various salt concentrations (NaCl and CaCl2, 10–30 mg/L)These improvements are consistent with the enhanced peak definition and increased signal-to-noise ratios observed in the PFBA chromatographic behavior section. Both NaCl and CaCl2 produced similar LOD and LOQ ranges, with the values at 20–30 mg/L being consistently lower than those at 10 mg/L. Combined, these results demonstrate that modest salt concentrations in the tested range are sufficient to enable routine PFBA quantification, whereas salt-free conditions did not support reliable detection in this analytical setup. Reproducibility and detection performance across the full PFAS target list under each salt condition are summarized in Table S4. RSD values for short- to mid-chain PFAS were generally below 15% across all conditions, while higher variability observed for longer-chain compounds (PFNA, PFOS) under NaCl conditions is attributable to signal instability near the detection limit at 1 ng/L. LOD and LOQ values ranged from 0.05–2.53 ng/L and 0.16–8.43 ng/L, respectively, across all compounds and conditions. For clarity, we note that RSD values refer specifically to peak area reproducibility at 1 ng/L. LOD and LOQ were determined using signal-to-noise ratios of 3 and 10, respectively, and are reported as single values per condition, as is standard practice. Matrix effects at each salt level are presented as calculated response ratios in Fig. 3.
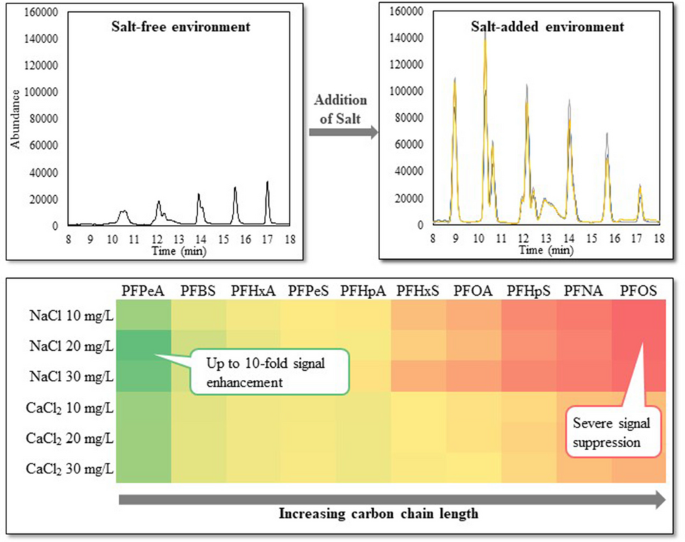
Response of other PFAS under varying salt concentrationTo assess whether the salt-dependent response extended beyond PFBA, chromatograms of all target analytes were compared at 50 ng/L under salt-free and salt-added conditions (Fig. 2). Under salt-free conditions (Fig. 2a), PFBA was not readily distinguishable as a discrete chromatographic peak, whereas other early-eluting short-chain PFAS (e.g., PFPeA) produced observable peaks. Several longer-chain PFAS also yielded identifiable peaks without added salt, indicating that the salt-free condition did not uniformly suppress responses across the target list.
Fig. 2
Representative chromatograms of the full PFAS target list at 50 ng/L under a salt-free, b NaCl-added (30 mg/L), and c CaCl2-added (30 mg/L) conditions. Peak assignments: 1, PFBA; 2, PFPeA; 3, PFBS; 4, PFHxA; 5, PFPeS; 6, PFHpA; 7, PFHxS; 8, PFOA; 9, PFHpS; 10, PFNA; 11, PFOS
After salt addition (Fig. 2b, c), the peak responses increased for multiple PFAS across the chromatogram. PFBA showed the most pronounced qualitative change, shifting from an indistinct response under salt-free conditions to a well-defined peak after salt addition. The increase was not confined to the shortest-chain analytes; several mid- and long-chain PFAS also exhibited higher peak intensities in the presence of salt, indicating that the response changes extended across a broad range of chain lengths under the same run conditions.
Comparisons of NaCl and CaCl2 revealed differences in the relative peak patterns. NaCl tended to accentuate chain length-dependent contrast more than CaCl2 did, with several short-chain PFAS becoming relatively more prominent in the NaCl chromatogram (Fig. 2b). Visual inspection of the salt-added chromatograms (Fig. 2b, c) revealed that short-chain PFAS could display relatively large peaks relative to some longer-chain homologs, a pattern that differs from what is often observed in reversed-phase LC, where longer-chain PFAS tend to appear more prominent. These findings indicate that salt addition can alter the apparent chain-length distribution in the chromatogram, even when all the analytes are prepared at equal concentrations.
To quantify these qualitative observations, matrix effects were calculated for each PFAS under salt-added conditions relative to the salt-free baseline (Fig. 3). Short-chain PFAS exhibited the largest positive matrix effects, with PFPeA reaching a 733–1005% increase under NaCl (approximately seven- to tenfold increase). PFBS and PFHxA showed similarly strong responses (414–500% and 336–386%, respectively), which is consistent with the improved peak definition shown in Fig. 2. As the chain length increased, the matrix effects generally decreased: mid-chain compounds such as PFHpA and PFOA showed moderate increases (272–370% and 91–297%, respectively), while PFNA exhibited near-zero to slightly negative effects under NaCl conditions (− 21% to − 0.3%). PFOS was notably suppressed by NaCl (− 74% to − 56%) but enhanced by CaCl2 (137–173%), illustrating a clear divergence between salt types for longer-chain compounds.
Fig. 3
Matrix effects of NaCl and CaCl2 on 50 ng/L PFAS responses in online SPE–LC–MS/MS analysis. The salt concentrations tested were 10, 20, and 30 mg/L. PFBA is not shown because it did not produce a quantifiable peak under salt-free conditions
The chain-length-dependent response patterns and salt-type divergence observed in the present study are consistent with several mechanisms documented in the prior literature [9, 33, 35, 36, 38, 39]. Regarding PFAS–ion interactions, salting-out, and surface activity, inorganic salts are known to influence PFAS partitioning through two co-occurring mechanisms. First, increasing ionic strength compresses the electrical double layer on charged sorbent surfaces, reducing electrostatic repulsion between anionic PFAS head groups and the sorbent and thereby promoting retention [9]. Second, the salting-out effect reduces PFAS aqueous solubility and promotes their accumulation at interfaces—including the SPE sorbent surface during loading and the ESI droplet surface during ionization [35]. In the present online SPE–LC–MS/MS system, both mechanisms may each contribute to the observed signal enhancement, but their relative contributions cannot be quantified without dedicated control experiments such as direct injection or post-column infusion.
Regarding divalent versus monovalent cation effects, divalent Ca2+ can engage in cation bridging between negatively charged PFAS head groups and negatively charged surface sites, an interaction that is particularly pronounced for longer-chain perfluorosulfonates such as PFOS [9, 39]. Steffens et al. (2021) demonstrated that divalent cations promote greater surface aggregation of PFOS at the air–water interface than monovalent cations, attributable to the higher charge density and bridging capacity of Ca2+ [35]. In the present study, the near-equivalent ionic strength comparison (NaCl 30 mg/L, IS ~ 0.51 mM vs CaCl2 20 mg/L, IS ~ 0.54 mM) revealed divergent PFAS responses despite nearly identical ionic strengths, suggesting that cation identity contributes independently to the observed differences. It is possible that Ca2+-mediated cation bridging enhances retention of longer-chain PFAS on the PLRP-S sorbent surface or increases their interfacial accumulation within ESI droplets [9, 35, 36], thereby producing the enhancement observed for PFOS under CaCl2 conditions. Under NaCl conditions, the absence of a bridging mechanism combined with the higher molar concentration of Na+ at equal mg/L may instead contribute to suppression of the response of longer-chain PFAS [9, 36]. These interpretations remain speculative in the absence of direct mechanistic experiments.
Regarding chain-length dependence, short-chain PFAS such as PFBA are highly polar and weakly hydrophobic, resulting in poor retention on reversed-phase sorbents under aqueous loading conditions [33]. Their retention on the PLRP-S cartridge is therefore governed more strongly by electrostatic than hydrophobic interactions, making it disproportionately sensitive to ionic strength changes [9, 38]. Even the modest ionic strength increases introduced by 10–30 mg/L NaCl or CaCl2 can substantially improve SPE retention of short-chain PFAS, while long-chain PFAS—already well-retained via hydrophobic interactions—show only marginal changes [9, 33, 38]. This differential sensitivity is further amplified in the present system by the fact that PFBA produced no quantifiable signal under salt-free conditions, meaning that even minor retention improvements translated to dramatic changes in observed peak area.
Both NaCl and CaCl2 showed systematic differences in their concentration-dependent trends (Fig. 3). Short-chain PFAS responses to NaCl peaked at 20 mg/L before decreasing slightly at 30 mg/L, whereas CaCl2 maintained stable increases across all concentrations. In contrast, longer-chain PFAS showed consistently larger matrix effects with CaCl2. This salt-type dependency is consistent with the chromatographic observations in Fig. 2, where NaCl amplified the chain-length contrast more strongly than CaCl2 did. The wide range of matrix effects observed (from −74% to + 1005%) demonstrates that the ionic composition can substantially reshape the apparent PFAS profile. Because these changes were not fully normalized by internal standardization (the PFBA chromatographic behavior section), caution is warranted when comparing PFAS data across water matrices with differing ionic compositions.
Based on these findings, accurate PFAS quantification by online SPE–LC–MS/MS should include explicit evaluation of ionic composition, particularly for short-chain PFAS such as PFBA. For waters with variable ionic strength, matrix-matched calibration or standard addition is recommended. Because isotope dilution may not fully compensate for salt-dependent response changes in short-chain PFAS, additional quality-control procedures, such as post-column infusion tests or matrix-effect assessment, should be incorporated during method validation. Reporting sample ionic composition together with PFAS concentrations would improve comparability across monitoring studies.
Comments (0)