
Remember me




A frequently cited argument in favour of the four type 2 diabetes subtypes is that they have been replicated in several independent studies across diverse populations [6, 9]. Initially, Ahlqvist et al [8] replicated the diabetes subtypes in three Scandinavian cohorts. According to the Precision Medicine in Diabetes Initiative (PMDI) systematic review on subclassification of type 2 diabetes [6], the subtypes have since been directly replicated in at least 22 studies that included around 88,000 individuals from diverse ethnic and ancestral origins (e.g. in German [14], North American [15], Chinese [15] and Japanese [16] cohorts).
However, there is substantial methodological variability in how these different studies aimed to replicate the four type 2 diabetes subtypes. Varghese et al [17] distinguish between three different levels of replication. The first level directly uses the cluster coordinates identified in the original Swedish cohort (All New Diabetics in Scania [ANDIS]) and applies them to another population (e.g. [14, 18]). This has also been referred to as the ‘nearest centroid approach’ [14]. The second level involves de novo clustering in a different population but with the a priori assumption that there are exactly four discrete subtypes (e.g. [15, 19]). In k-means cluster analysis, this corresponds to having a pre-defined k-value that determines the number of clusters (i.e. k=4). The third level involves de novo clustering without such an a priori assumption, therefore allowing a different number of clusters to emerge from the analysis (e.g. [16, 20]).
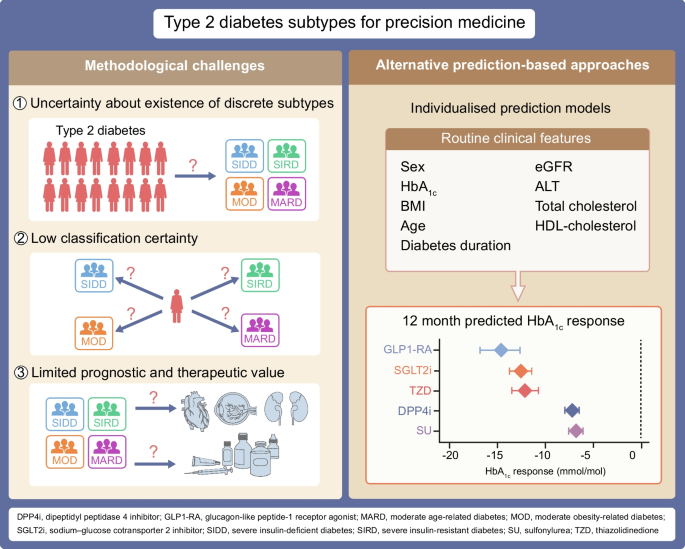
The first two approaches automatically presume the existence of four discrete subtypes and therefore do not replicate the cluster analysis as a whole. The most convincing evidence would stem from the third approach, with confirmation in independent studies that four clusters provide an ideal subclassification of type 2 diabetes. However, in their literature review, Varghese et al [17] found that only 18 of 43 replication studies (42%) followed the third approach. Of these 18 studies, only seven (39%) were able to successfully replicate the four type 2 diabetes subtypes and the remaining 11 studies either identified different subtypes or failed to identify all of the subtypes proposed by Ahlqvist et al [8]. For example, Christensen et al [20] found only three instead of four type 2 diabetes subtypes when applying the same clustering procedure (i.e. k-means clustering with the same variables) in a Danish cohort.
However, it should be noted that not all of these replication studies had access to all five continuous clustering variables used by Ahlqvist et al [8]. In particular, HOMA2 measures were unavailable in four out of 18 studies (22%) [17]. Indeed, there has been considerable interest in replicating the diabetes subtypes with more readily available clinical features (i.e. without HOMA2 measures) [6, 21,22,23,24]. For example, Lugner et al [21] performed k-means clustering on data from the National Diabetes Register of Sweden using a different set of variables. Instead of HOMA2 measures they included six other routinely measured clinical features (systolic BP, diastolic BP, HDL-cholesterol, LDL-cholesterol, triacylglycerols and eGFR). However, a recent study suggests that such modified sets of clustering variables may not be suitable for identifying the four subtypes using de novo clustering [23]. In particular, HOMA2 measures appear to be indispensable for identifying individuals with SIRD [23, 25]. Therefore, replication studies with modified sets of clustering variables cannot provide definitive evidence for or against the four diabetes subtypes proposed by Ahlqvist et al [8]. Nevertheless, they illustrate that the results of diabetes cluster analyses are not unequivocal but are dependent on the specific input variables, clustering algorithm and population [6].
From a methodological perspective, a challenge of the subtypes is that they were derived from a data-driven cluster analysis (analogous to unsupervised learning), meaning that no ‘ground truth’ was available [26]. In other words, there is no way of knowing whether the proposed diabetes clusters correspond to true biological subgroups of diabetes, or whether they arise because a set of interdependent variables (e.g. BMI, insulin resistance, HbA1c) is entered into the clustering algorithm. In this sense, clustering can be seen as another way of capturing correlations between clinical features. However, unlike correlation analysis, it does not provide inferential tools like CIs or p values [27, 28]. Instead, cluster analysis relies on heuristic methods such as elbow plots or gap statistics to determine the optimal number of clusters from the data [27]. In other words, while cluster analysis is a useful tool for grouping similar data points together, its utility for discovering biologically distinct diabetes subtypes remains unclear.
To assess whether the proposed subtypes could be driven by correlations between clinical features, rather than by an underlying subgroup structure, Aoki et al [29] carried out a simulation study. They simulated a virtual patient dataset without any subgroups but preserving the correlation structure between the clustering variables. The assumed correlations were based on empirical data from the multinational SAVOR-TIMI 53 cardiovascular outcome trial [30]. For example, they included a strong positive correlation (r=0.5) between HbA1c and fasting glucose (used for HOMA2 calculation) and a moderate negative correlation (r=−0.25) between HbA1c and age at diabetes onset [29]. When they applied k-means clustering to these simulated data, the algorithm still reproduced the four subtypes (SIDD, SIRD, MOD and MARD), even though no discrete subgroups were present. A limitation of these findings is that the empirical basis for the virtual patient dataset (the SAVOR-TIMI 53 trial) might not be entirely suitable for studying the diabetes subtypes. In particular, the simulation was based on a multi-ancestry population with long-standing diabetes (mean of 8.7 years) and established CVD. Moreover, as the findings are based on a simulation study, they cannot be interpreted as definitive evidence against the existence of discrete subtypes. However, they illustrate that data-driven diabetes clusters could, in theory, be driven by correlations between clinical features rather than by discrete biological subgroups.
Taken together, the findings presented above suggest that there is considerable uncertainty regarding the existence of four discrete subtypes of type 2 diabetes. Nevertheless, the subtypes still appear to capture meaningful and clinically relevant differences in diabetes pathophysiology [8, 14, 31]. Aetiological differences between subtypes are considered further in the discussion section.
Low certainty in subtype assignmentAs well as the general uncertainty regarding the existence of four discrete subtypes, there is also uncertainty at the individual level when assigning people to these subtypes. While each individual with type 2 diabetes can technically be assigned to a subtype using the clustering algorithm, not every individual will match with that subtype equally well [2, 32]. Even in the original publication of Ahlqvist et al [8], a close examination of the distribution of clinical features reveals large variability within each subtype. For example, not every individual with SIRD shows severe insulin resistance and not every individual with SIDD exhibits reduced insulin secretion. In line with this, Pearson [2] argues that the phenotypic variability of type 2 diabetes may be difficult to capture with just four categories and that individual classification probabilities may be low.
In practice, this means that an individual’s clinical profile may lie between two subtypes (e.g. sharing similarities with both MOD and MARD) [25, 33] or not match any of the four subtypes [2]. For an illustrative example of borderline cases falling between two subtypes, consider the two individuals shown in Table 1. The clinical profiles of the two individuals are almost identical, except for a 0.5 kg/m2 difference in BMI. Yet, the clustering algorithm (nearest centroid approach based on the cluster coordinates from the ANDIS cohort [8]) assigns individual A to the MARD subtype and individual B to the MOD subtype. For such individuals, the subtype assignment is unstable, as small changes in clinical variables may lead to a different subtype. Consequently, their classification certainty is low and subtype-specific risk predictions may be less reliable. Moreover, measurement error as well as longitudinal biological changes (e.g. in HbA1c or BMI) may lead to changes in subtype assignment [34]. For example, in the German Diabetes Study almost one out of four individuals changed their subtype within 5 years after diagnosis [14]. Besides natural disease progression, subtype assignment may also change in response to treatment, as some of the cluster variables represent therapeutic targets (e.g. HbA1c and BMI) [12]. For example, an individual with a BMI of 35 kg/m2 at diagnosis might change their subtype after successful weight loss following treatment with glucagon-like peptide-1 receptor agonists (GLP1-RAs).
Table 1 Example of two individuals who lie between two type 2 diabetes subtypesIn response to this problem, the second PMDI consensus report [10] recommends that diabetes subtype assignments should always be accompanied by a measure of classification uncertainty. In principle, there are several measures that can be used to assess an individual’s classification uncertainty [35], ranging from graphical displays (e.g. spider plots) to statistical measures (e.g. Euclidean distance [8], distance ratio [22], classification probability [36, 37] and normalised relative entropy [NRE] [35]) (see Text box, ‘Measures of classification uncertainty’). Figure 2 shows an illustrative example of different measures of classification uncertainty applied to individuals A and B from Table 1.
 Fig. 2
Illustrative example of different measures of classification uncertainty applied to individual A (a, c, e) and individual B (b, d, f) from Table 1. (a, b) The spider plots show that both individuals share a similar clinical profile, which does not match entirely with either MARD or MOD. (c, d) Because of their higher BMI by 0.5 kg/m2, individual B has a minimally smaller Euclidean distance to the MOD centroid (i.e. the typical MOD profile). (e, f) As a result, the classification probability for MOD is slightly higher than that for MARD. Because both individuals lie at the border between MOD and MARD, they have a low classification certainty, as indicated by the low classification probabilities and NRE values close to zero. This figure is available as part of a downloadable slideset
In practice, however, measures of classification uncertainty have rarely been reported in studies of the type 2 diabetes subtypes [22, 35,36,37]. A recent study proposed using the NRE statistic to quantify an individual’s classification uncertainty on a scale from 0 (complete uncertainty) to 1 (complete certainty) [35]. Application of this method to a cohort of 859 individuals from the German Diabetes Study revealed a low median NRE of 0.13 (95% CI 0.12, 0.14), indicating substantial classification uncertainty. While the degree of uncertainty might vary depending on the cohort and the chosen measure, current evidence shows that a certain level of classification uncertainty is inevitable [22, 35,36,37]. It is therefore essential to acknowledge this limitation of discrete subtyping and to routinely report uncertainty measures.
A general problem of hard subtype assignment is that, by definition, it reduces the information available in a system. Even when the classification probability for one subtype is clearly higher than the probabilities for the other subtypes, the relative magnitude of the classification probabilities still carries information about an individual’s clinical profile. Indeed, it has been suggested that the classification probabilities or Euclidean distances should be directly related to clinical outcomes, rather than the hard subtype assignment [26]. Alternatively, measures of classification uncertainty can be used to mitigate some of the information loss that occurs when comparing clinical outcomes between hard subtype assignments [35]. For example, individuals can be weighted by their NRE, such that those who are less representative of their subtype contribute less to the analysis. Another option is to use alternative prediction-based approaches for precision medicine instead of diabetes subtypes, as discussed in the next section.
Limited prognostic and therapeutic value of subtypesThe third challenge of the subtyping approach is that the information loss due to hard subtype assignments is disadvantageous for predicting clinical outcomes (i.e. precision prognostics) [26, 34]. Instead, it would be more informative to use statistical models that directly incorporate continuous clinical features as predictors. This issue has been investigated in several studies comparing the performance of type 2 diabetes subtypes with conventional prediction models [19, 29, 38].
Aoki et al [29] compared the predictive performance of the subtypes to that of established clinical risk scores using data from the SAVOR-TIMI 53 trial, which included individuals with established CVD and long-standing diabetes (mean of 8.7 years). They employed the widely used Systematic Coronary Risk Evaluation (SCORE) [39] and the Kidney Disease: Improving Global Outcomes (KDIGO) classification [40] to predict CVD and kidney outcomes, respectively. Even though the CVD SCORE was treated as a broad ordinal variable (10 year CVD risk of ≤5%, 5–10%, 10–15%), its prognostic performance was similar to that of the subtypes (concordance index [c-index] 0.57 and 0.56 [95% CI not reported], respectively). For kidney events, prediction using the KDIGO classification clearly outperformed the subtype approach (c-index 0.62 and 0.54 [95% CI not reported], respectively). Similar results were found by Bjarkø et al [38], who assessed the predictive performance of the subtypes in a Norwegian population-based study. Using data from the Trøndelag Health Study (HUNT Study), they found that individual established risk factors (e.g. HbA1c, eGFR) were at least as good as the subtypes for predicting vascular complications (e.g. retinopathy, chronic kidney disease). In a re-analysis of the ADOPT [41] trial (median follow-up time of 4 years), Dennis et al [19] found that age at diagnosis alone was as informative as the subtype classification for predicting glycaemic disease progression (R2=0.09 and 0.08, respectively).
Beyond precision prognostics, Dennis et al [19] critically examined the subtypes’ potential for precision treatment. They found that the subtypes differed modestly in their response to glucose-lowering drugs in the ADOPT trial, which compared metformin, sulfonylurea and thiazolidinedione treatment. However, a model that directly used the clustering variables as predictors, even without HOMA2 measures, explained individual treatment response substantially better. When predicting response to sulfonylureas, the model explained 33% of the variability in treatment response, compared with 20% for the subtype-based approach. Similar results were found when predicting response to thiazolidinedione treatment (R2model=0.32 vs R2subtypes=0.17) and metformin treatment (R2model=0.35 vs R2subtypes=0.15). To further compare these two approaches, Dennis et al [19] performed an external validation using the RECORD trial [
Comments (0)