
Remember me

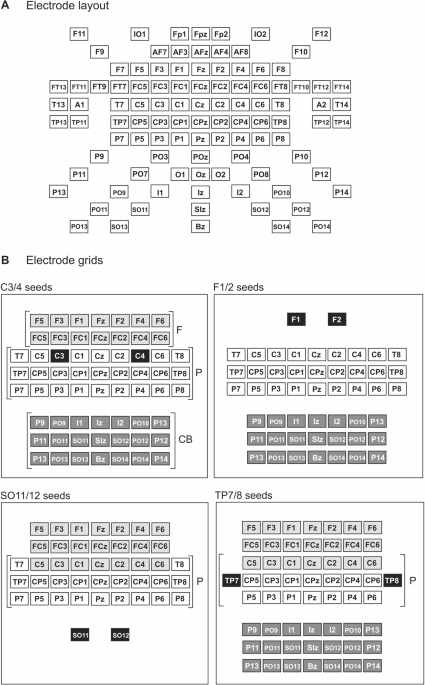
In what follows we describe the details of mapping analyses for four choices of SEED pair electrodes (with four corresponding ANOVA tables). The procedure for choice of SEED was to start over the known cerebral sensorimotor areas for the left and right hands, i.e. at C3/C4 (“Coherence Maps with Sensorimotor Area Seeds C3/C4” section), create coherence maps and then locate apparent distal focal sites within these, close to regions of interest. The maps created by the C3/C4 SEEDs suggested distal focal points at F1/F2, close to premotor cortex/SMA, and these were then selected for the 2nd maps (“Coherence Maps with Frontal Seeds F1/2” section). The maps created from the F1/F2 SEEDs then in turn suggested other distal focal points, including at SO11/SO12, close to the expected location of the posterior cerebellar sensorimotor homunculus (“Coherence Maps with Cerebellar Seeds SO11/12” section). The maps created from the SO11/SO12 SEEDs, as well as apparent reciprocal focal sites near F1/F2 also appeared to show focal sites at lateral posterior parietal positions, hence the choice of TP7/TP8 SEEDs (“Coherence Maps with Posterior Parietal Seeds TP7/TP8” section). For the “at rest” conditions the ANOVA SEED factor was uniquely defined. For the movement conditions the factors SEED and HAND collapsed to a single SEED/HAND factor, e.g. C3/RH versus C4/LH. In the final “False Discovery Rate (FDR) analysis” section we attempt to provide a summary analysis of general observations from the four mapping analyses.
Coherence Maps with Sensorimotor Area Seeds C3/C4 Rest EffectsFigure 3 A/B illustrates the maps produced at C3/C4 at rest. The resting coherence maps are generally homogenous, although they do show some evidence of a standing distribution of δ/θ-coherence in frontal, parietal and cerebellar sites, manifest in terms of X and Y ANOVA effects. For the frontal sites, excluding the Cz row, this is symmetrical about the positive phase midline (δ−band, F(6,30) = 3.8, p < .05). For the parietal sites, including the Cz row, it is also symmetrical about the positive phase midline and posteriorly (respectively for δ−band X and Y effects, F(8,40) = 5.3, p < .05 and F(2,10) = 8.7, p < .05 and for δ/θ-band X*Y effects F(16,80) = 3.9, p < .05 and F(16,80) = 6.6, p < .05). For the cerebellar sites the standing distribution of δ−coherence is generally skewed to the right hemisphere and anteriorly, manifest as an X*Y interaction (F(12,60) = 4.6, p < .05). There were no SEED or SEGMENT effects at rest.
Fig. 3
Coherence maps during rest and movement conditions using central seeds (C3/C4). Each panel displays the time–frequency imaginary cross-spectrum between the seed electrode and a single scalp electrode. The top row shows mappings using C3 (A) and C4 (B) as seeds during rest. The middle row presents coherence maps during right-hand (RH) and left-hand (LH) movements using C3 (C) and C4 (D) as seeds, respectively. The bottom row shows single-electrode maps at the frontal sites; F1 (E; RH movement) and F2 (F; LH movement)
Delta/theta-band Movement EffectsFigure 3 C/D respectively display the coherence maps for right and left hand movement respectively seeded at C3 and C4, approximately corresponding to the locations of the sensorimotor hand areas. Multiple additional movement and hand related features become apparent throughout the maps, manifest also in additional ANOVA effects (Table 1). Within the δ/θ-bands, superimposed on the standing distribution, are additional effects and interactions not present at rest due to the SEED/HAND and SEGMENT factors. For the frontal sites (Fig. 4A), while there were no significant main effects of SEED/HAND or SEGMENT, a trend interaction of HAND*Y*SEGMENT was obtained (p < .05), indicating movement and hand related changes in centro-frontal δ-coherence. For the parietal sites (Fig. 4B), there were no significant main effects or interactions involving the SEGMENT factor, but a highly significant HAND*X interaction appears (p < .001), indicating a hand-related skewing of the centro-parietal δ−coherence, which is consistent with the known crossed somatotopy of the cerebral sensorimotor representation. For the cerebellar sites (Fig. 4C), two-way Y*SEGMENT (p < .05) and three-way interactions HAND*Y*SEGMENT (p < .05) were obtained.
Fig. 4
Changes in delta coherence with C3/4 seeds. ANOVA effects are shown for changes in centro-frontal (A), centro-parietal (B) and centro-cerebellar (C) coherence. In (A) Y = 1–2 refers to the Fz (midline frontal) and FCz (midline fronto-central) rows; in (B) X = 1–9 refers to the TP7, CP5, CP3, CP1, Cpz, CP2, CP4, CP6 and TP8 columns; in (C) Y = 1–3 refers to the Iz, SIz and Bz rows. Points represent estimated marginal means from the repeated-measures ANOVA. Error bars indicate ± 1 SEM; n = 6 participants
Table 1 ANOVA effects for Cz row seeds Beta-band Movement EffectsIn addition to the low-frequency δ/θ-effects, β-band effects are also present in both the centro-frontal and centro-cerebellar coherence. For the frontal leads these are manifest in both a trend main effect of SEGMENT (p < .05) and a three-way interaction HAND*X*SEGMENT (p < .05) (Fig. 5A), consistent with the somatotopy of the cerebral sensorimotor representation, i.e. with right hand effects maximal in the left hemisphere (F1 column) and vice-versa (F2 column). For the cerebellar leads the β-band effect is primarily a trend main effect of SEGMENT (p < .05), with no spatial focus (Fig. 5B). For the centro-frontal β-effects, as well as being spatially focused with the expected somatotopy, they are dominated by post-movement segments, i.e. represent primarily a reafference, as illustrated by pair-wise comparison. The centro-cerebellar movement-related β-coherence in contrast appears to show pre- as well as post-movement changes, as supported by pair-wise comparison (Fig. 5B).
Fig. 5
Changes in beta coherence with C3/4 seeds. ANOVA effects are shown for the changes in centro-frontal (A) and centro-cerebellar (B) coherence. In (A) X = 1–7 refers to the FC5, FC3, FC1, FCz, FC2, FC4 and FC6 columns. * p < .05, *** p < .005. Points represent estimated marginal means from the repeated-measures ANOVA. Error bars indicate ± 1 SEM; n = 6 participants
Coherence Maps with Frontal Seeds F1/2 Seed SelectionThe C3/C4 seeded maps above revealed significant δ/θ- and β-band coherence which showed varied spatial and temporal distributions in frontal, parietal and cerebellar targets. In this section we report the properties of coherence maps seeded at F1 and F2 (Figs. 6, 7 and 8; Table 2), which were close to the spatial focus of the C3/C4 seeded β-coherence (Fig. 3E/F).
Fig. 6
Coherence maps for F1 and F2 (frontal) seeds during rest (A & B) and movement (C & D)
Fig. 7
Changes in delta coherence with F1/2 seeds. ANOVA effects are shown for changes in fronto-parietal (A) and fronto-cerebellar (B) coherence. In (A) X = 1–9 refers to TP7, CP5, CP3, CP1, CPz, CP2, CP4, CP6 and TP8 columns; in (B) X = 1–7 refers to P11, PO11, SO11, SIz, SO12, PO12 and P12 columns and Y = 1–3 refers to the Iz, SIz and Bz rows. Points represent estimated marginal means from the repeated-measures ANOVA. Error bars indicate ± 1 SEM; n = 6 participants
Fig. 8
Changes in gamma, beta and alpha coherence with F1/2 seeds. ANOVA effects are shown for changes in fronto-parietal (A) and fronto-cerebellar (B) coherence. In (A) Y = 1–3 refers to the Cz, CPz and Pz rows; in (B) X = 1–7 refers to the P11, PO11, SO11, SIz, SO12, PO12 and P12 columns. Points represent estimated marginal means from the repeated-measures ANOVA. Error bars indicate ± 1 SEM; n = 6 participants
Table 2 ANOVA effects for Fz row seeds Delta-band Movement EffectsFrom visual inspection of the F1/F2 rest coherence maps (Fig. 6A/B), unlike the C3/C4 seeded map, there is no apparent low-frequency standing coherence either in parietal or cerebellar electrode grids. However, prominent movement-related δ/θ-coherence becomes apparent in both parietal and cerebellar sites for left and right handed movement (Fig. 6C/D). This is manifest in main effects of SEGMENT at both parietal and cerebellar sites in the parietal and cerebellar grids (respectively p < .05 and p = .005) (Fig. 7A/B), as well as interactions with SEED/HAND, X and Y for the parietal grid (p = .001), and with Y, but not X in the cerebellar grid (p < .05) (Table 2). The parietal three-way interaction is accompanied by a HAND*X interaction (p = .001), which indicates a right hand dominated skewing of the fronto-parietal δ−coherence, parallel to the centro-parietal effects above.
Alpha/beta/gamma-band Movement EffectsThe fronto-cerebellar δ−coherence in contrast does not indicate any SEED/HAND effects, but α/β-band X and HAND*X effects are present indicating skewing to the right-hemisphere (Fig. 8B), with a trend X*Y δ-effect (p = .065; Fig. 6B, second row) supporting a skewing peak over the SO12 column. We also observed fronto-parietal higher frequency main effects of SEGMENT (γ-band, p < .05) and a SEGMENT*Y interaction (γ-band, p = .005, β-band, p = .06) (Fig. 8A; Table 2).
Coherence Maps with Cerebellar Seeds SO11/12 Seed SelectionBoth central and frontal seeds give rise to movement related δ/θ-coherence in the cerebellar grid in the form of either SEGMENT main effects or SEGMENT*Y interactions, suggesting foci within the SIz or Bz rows, i.e. at Y = 2 & 3, but with no strong X preference for selecting cerebellar seeds to investigate reciprocal cerebello-cerebral coherence. However, given the X*Y trend effect described above, we select SO12/SO11 as SEED locations for RH/LH respectively, which are also approximately where we would expect the posterior cerebellar hand representation to be located, crossed relative to the cerebral representation (Fig. 9).
Fig. 9
Coherence maps with cerebellar seeds (SO11/12) during rest (A & B) and movement (C & D). The bottom row shows single-electrode maps at the frontal sites; F2 (E; LH movement) and F1 (F; RH movement)
Rest EffectsAs with the central seeds, the SO12/SO11 seeds appear also to show a standing spatial distribution of δ/θ-coherence in frontal and parietal sites (Fig. 9A/B). This is apparent in a rest ANOVA with a δ-band X effect in frontal grid (p < .005), and δ-band X and Y effects in the parietal (respectively p < .001 and p < .005).
Delta/theta Movement EffectsAs with the C3/C4 case, hand movement induces additional ANOVA effects (Table 3) on top of the standing effects. For the frontal grid these are in the form of SEGMENT main effects (p < .01 and p = .005) and SEGMENT interactions with X, Y and HAND, depending on the X extent (+- 3 or +- 2) due to the midline focus (Table 3). If the X extent is restricted to +- 2 from the midline, the SEGMENT*X*HAND δ-band interaction (p < .05) is consistent with crossed cerebello-frontal projections (Fig. 10). For the parietal grid, movement-related δ/θ-coherence trend effects are also obtained in the form of SEGMENT main effects (respectively p = .07 and p < .05 for δ- and θ-bands), along with a SEGMENT^X interaction (p < .05) (Table 3). The δ-band SEGMENT main effect is partially cancelled by the change in sign of phase from –ve to +ve away from the midline, as is clear in the SEGMENT*X interaction, and indeed in the X main effect (p < .005) and X*Y effect (p = .001) which confirms the visual impression of strong movement-related δ/θ-coherence effects laterally, especially in the Cz and CPz rows (Y = 1, 2), i.e. at the T7/T8 and TP7/TP8 sites.
Table 3 ANOVA effects for SIz row seedsFig. 10
Changes in delta coherence with SO11/12 seeds. ANOVA effects are shown for changes in cerebello-frontal (A) and cerebello-parietal (B) coherence. In (A) X = 1–5 refers to the FC3, FC1, FCz, FC2 and FC4 columns; in (B) X = 1–9 refers to the TP7, CP5, CP3, CP1, CPz, CP2, CP4, CP6 and TP8 columns, Y = 1–3 refers to the Cz, CPz and Pz rows. Points represent estimated marginal means from the repeated-measures ANOVA. Error bars indicate ± 1 SEM; n = 6 participants
Coherence Maps with Posterior Parietal Seeds TP7/TP8 Seed SelectionGiven in particular the cerebello-parietal effects observed in "Coherence Maps with Cerebellar Seeds SO11/12" section, for completeness, we also generated the maps and ANOVA statistics with TP7/TP8 seeds (Figs. 11 and 12). However, given no prior obvious somatotopic lateralisation for the lateral posterior parietal sites, unlike the central, frontal and cerebellar sites, the hand asymmetry observed in 3.2 for the fronto-parietal coherence, and thus no clear basis to allocate a distinct handedness to a seed site, the statistics is based on the TP7 seed only for both left and right hand movement. There is thus no SEED factor. Visual inspection indicates strong parieto-parietal (latero-medial) effects and these are also included in the ANOVA results (Table 4).
Fig. 11
Coherence maps with parietal seeds (TP7/8) during rest (A & B) and movement (C & D)
Fig. 12
Delta and theta coherence changes with the TP7 seed. ANOVA effects are shown for changes in parieto-frontal (A; left column), parieto-parietal (B; middle column) and parieto-cerebellar (C; right column) coherence. In (A) X = 1–7 refers to the FC5, FC3, FC1, FCz, FC2, FC4 and FC6 columns; in (B) X = 1–7 refers to the CP5, CP3, CP1, CPz, CP2, CP4 and CP6 columns, Y = 1–3 refers to the Cz, CPz and Pz rows; in (C) Y = 1–3 refers to the Iz, SIz and Bz rows. Points represent estimated marginal means from the repeated-measures ANOVA. Error bars indicate ± 1 SEM; n = 6 participants
Table 4 ANOVA effects for CPz row seeds Delta/theta-band Movement EffectsAll three grids at frontal, parietal and cerebellar sites show highly significant δ-band SEGMENT main effects (respectively, p < .005, p < .005 and p = .005) (Fig. 12A-C) and these extend to the θ-band (respectively, p < .01, p < .05 and p = .005). Highly significant δ/θ-band X-effects are also observed in frontal and parietal sites, consistent with a focus toward the midline. The frontal sites also yield a θ-band HAND*X*SEGMENT interaction (Fig. 12A) and a θ-band HAND*SEGMENT interaction (Fig. 12B) is observed at the parietal sites, indicative of right hand dominance. The cerebellar sites in contrast show no obvious HAND or X effects (Table 4).
False Discovery Rate (FDR) AnalysisSupplementary Fig. 1 illustrates a FDR plot for all p-values presented in Tables 1, 2, 3 and 4 in seven lumped categories with FDR q = 0.05, 0.1 and 0.2 indicated. This analysis indicates that for effects with reported p-values < 0.001 there is low risk of a false positive at q = 0.05 or less. For effects with p-values between 0.001 and 0.01 type I error risk increases to between 0.1 and 0.2, but still remains sub-threshold for our exploratory study. For effects with p-values < 0.05 and > 0.01, most will become supra-threshold for q = 0.2 with the critical value of p = .019. As noted above, we will, therefore, treat such effects as trends. However, as we discuss below, it is important to consider the distribution of such trend effects among the ANOVA (spectral power, SEED/TARGET combination) and factor categories in order to avoid type II error. Of particular relevance, we note that within each of the seven lumped p-value categories the proportion which fall within the δ/θ-bands are respectively, 100% (p < .001), 100% (p = .001), 91% (p < .005), 88% (p = .005), 86% (p < .01), 50% (p = .01) and 79% (p < .05). Thus the proportion of the p < .05 category within the δ/θ-bands is four times greater than chance alone (20%). Even among the p > .05 tail the proportion within the δ/θ-bands is 47%, more than twice the chance rate.
Evidence for Crossed Cerebro-cerebellar Connectivity in the MapsThe above four mapping analyses based at central, frontal, cerebellar and lateral parietal sites have shown predominantly (69%) δ/θ-band movement related SEGMENT effects, along with SEGMENT interactions with X, Y and HAND, consistent with a widespread δ/θ-band cerebro-cerebral and cerebro-cerebellar network for movement coordination. Of particular pertinence to the topic of cerebro-cerebellar connectivity, and for assessment of the validity of our proposed coherence mapping technique, is the question of what evidence is available within these effects for crossing in line with the known anatomy. For this purpose, we display in Fig. 13δ-band SEGMENT/HAND combinations for X and Y locations chosen using the SEED/HAND combinations employed for the maps.
Fig. 13
Delta-band coherence changes for multiple seed–electrode combinations. Panels A–F show delta-band waveforms (− 2 to 2 s) for left-hand (LH; red) and right-hand (RH; blue) movement conditions, plotted for different seed configurations and electrode rows. (A–B) F1/2 and SO11/12 seeds across the Fz row (A) and SIz row (B). (C–D) TP7/8 and SO11/12 seeds across the CPz row (C) and SIz row (D). (E–F) F1/2 and TP7/8 seeds across the Fz row (E) and CPz row (F)
The top row (Fig. 13A) shows the movement-related δ-band changes along the Fz row with the SO11/SO12 seed combination. For the SO12/RH combination the maximum SEGMENT effect (-ve phase) is observed at F1, while for the SO11/LH combination the maximum is observed at F2, and this is manifest as a HAND*X*SEGMENT interaction (p < .05, Table 3, “Coherence Maps with Cerebellar Seeds SO11/12” section). The reciprocal mapping, is illustrated underneath (Fig. 13B). For the F1/RH combination the maximum reciprocal (+ ve phase) effect is at SO12 (the phase inversion SO12 seeded RH image), while for the F2/LH combination there is no outstanding lateralised maximum and no significant corresponding interaction (Table 2, “Coherence Maps with Frontal Seeds F1/2” section).
The next row (Fig. 13C) shows the movement-related δ-band changes along the CPz row with SO11/SO12 seed combinations. In contrast to the cerebello-frontal projection, it is maximal away from the midline, manifest as an X*SEGMENT interaction (p < .05, Table 3, “Coherence Maps with Cerebellar Seeds SO11/12” section), with the maxima observed at TP7/8, though there are no SEED/HAND effects, also unlike the frontal map. As with the fronto-cerebellar case (Table 2, “Coherence Maps with Frontal Seeds F1/2” section), the parieto-cerebellar mapping shows neither X nor HAND interactions.
For completeness, we also illustrate the cerebral cortico-cortical reciprocal movement-related changes in frontal (F1/F2) and parietal seeded maps (TP7/8) (Fig. 13D-F). As with the previous two cases, the frontal grid shows a midline maximal X distribution and the parietal grid a lateral X distribution. However, both exhibit a mutual δ- or θ-band HAND*X*SEGMENT interaction, demonstrating a dominance of the right hand and with some evidence of left hemisphere dominance.
Considering the above evidence together, it is useful to collate the critical effects together, which we do in Table 5 for the δ/θ-band and Table 6 for the α/β/γ-band effects. From these we can see that δ/θ-band main X-effects are present at both cerebral target sites, irrespective of the seed site, indicative of consistent cerebral medio-lateral gradients, absent in the cerebellar sites. The frontal sites also consistently exhibit SEED/HAND interactions, irrespective of the seed site, also generally absent from the cerebellar target sites. The cerebellar target sites in contrast stand out as showing general δ/θ-band SEGMENT main effects with no other interactions, other than a Y-gradient with the C3/4 seeds.
Table 5 Summary of δ/θ-band movement-related coherence effectsTable 6 Summary of α/β/γ-band movement-related coherence effectsWhile HAND*X*SEGMENT interactions are absent in the F1/F2-seeded δ/θ-band coherence, this three-way interaction is uniquely present in the F1/F2-seeded β/γ-band coherence at the frontal sites (Table 6), which as we note above, is consistent with the established somatotopy of the cerebral sensorimotor representation. β/γ-band SEGMENT main effects are obtained in two other cases, i.e. within the cerebellar targets with C3/4 (motor) seeds, and within the parietal targets with F1/F2 (premotor) seeds.
Comments (0)