
Remember me

The sample included 9 individuals with SCA6 and 8 healthy controls. Overall, no significant differences were found between groups regarding age or years of education, whereas estimated IQ showed a borderline difference (p = 0.051), with lower scores in the SCA6 group; the corresponding data are presented in Table 1. Within the SCA6 group, exploratory Spearman correlations indicated that the number of failed CCAS-S domains was not significantly associated with age (ρ = 0.383, p = 0.309; 95% CI [− 0.377, 0.835]) or years of education (ρ = −0.433, p = 0.244; 95% CI [− 0.852, 0.324]), suggesting that these demographic variables did not substantially influence the number of failed CCAS-S domains.
Table 1 Demographic and global measures for the SCA6 and control groupsExecutive FunctionsPerformance on the Hayling Test, measured by total completion time (mean ± SD, seconds), a time-dependent measure sensitive to inhibitory control, was poorer in the SCA6 group (117.60 ± 74.50, SE 26.34) than in controls (45.29 ± 17.67, SE 6.25; mean difference 72.31, 95% CI [9.58, 135.03]; p = 0.01; d = 1.34). Performance on the Stroop Test, assessed by completion time (mean ± SD, seconds), a time-dependent measure sensitive to selective attention, was also poorer in patients (19.82 ± 4.12, SE 1.37) than in controls (14.30 ± 2.95, SE 1.04; mean difference 5.52, 95% CI [1.83, 9.21]; p = 0.007; d = 1.52). The contribution of motor slowing, reduced processing speed, and verbal output demands to performance on these time-dependent measures cannot be ruled out. In contrast, cognitive flexibility on the Hayling Test (mean ± SD; SCA6: 5.91 ± 3.05, SE 1.08; controls: 4.00 ± 1.38, SE 0.49; mean difference 1.90, 95% CI [− 0.74, 4.54]; p = 0.13; d = 0.80) and executive planning on the Tower of London (total score, mean ± SD; SCA6: 32.80 ± 1.79, SE 0.80; controls: 28.00 ± 7.12, SE 2.69; mean difference 4.80, 95% CI [− 1.83, 11.43]; p = 0.17; d = 0.85) did not differ significantly between groups.
MemoryImmediate visuospatial memory, assessed with the Corsi Blocks Forward (maximum span, mean ± SD), was slightly lower in the SCA6 group (7.67 ± 2.29, SE 0.76) than in controls (9.00 ± 1.60, SE 0.57; mean difference − 1.33, 95% CI [− 3.37, 0.70]; p = 0.190; d = − 0.67), although this difference was not statistically significant. Visuospatial working memory, measured with the Corsi Blocks Backward (maximum span, mean ± SD), followed a similar trend (SCA6: 6.67 ± 1.94, SE 0.65; controls: 8.38 ± 2.62, SE 0.93; mean difference − 1.71, 95% CI [− 4.15, 0.73]; p = 0.144; d = − 0.75), without reaching statistical significance. Verbal episodic memory, evaluated with the RAVLT delayed recall score (mean ± SD), was significantly reduced in SCA6 patients (6.44 ± 2.40, SE 0.80) compared with controls (12.00 ± 2.39, SE 0.85; mean difference − 5.56, 95% CI [− 8.04, − 3.07]; p < 0.001; d = − 2.32). Visuoconstructive and visual episodic memory abilities, assessed with the Rey–Osterrieth Complex Figure (copy and delayed recall scores, mean ± SD; maximum = 36 points), a task involving visuoconstructive and visuomotor integration, graphomotor skills, and organizational planning, showed trends toward poorer performance in the SCA6 group both on the copy condition (SCA6: 29.83 ± 8.63, SE 2.88; controls: 36.00 ± 0.00, SE 0.00; mean difference − 6.17, 95% CI [− 12.80, 0.47]; p = 0.062; d = − 0.98) and delayed recall (SCA6: 14.28 ± 8.95, SE 2.98; controls: 20.81 ± 6.39, SE 2.26; mean difference − 6.53, 95% CI [− 14.54, 1.47]; p = 0.108; d = − 0.83), although these differences did not reach statistical significance. The contribution of motor and visuomotor factors to performance on this task cannot be ruled out.
Language - Naming AbilitiesWithin the language domain, confrontation naming, assessed with the Boston Naming Test (total correct responses, mean ± SD; maximum score = 60), showed a trend toward poorer performance in the SCA6 group (52.11 ± 6.47, SE 2.16) compared with controls (56.50 ± 2.78, SE 0.98; mean difference − 4.39, 95% CI [− 9.60, 0.82]; p = 0.096; d = − 0.86), although this difference was not statistically significant.
Logical Reasoning and Visuoconstructive SkillsPerformance on the WASI Block Design subtest (total raw score, mean ± SD), a task involving visuoconstructive and visuomotor integration, constructional praxis, and manual dexterity under timed administration, was poorer in patients with SCA6 (27.4 ± 13.42, SE 4.74) than in controls (46.4 ± 9.93, SE 3.51; mean difference − 19.00, 95% CI [− 31.76, − 6.24]; p = 0.006; d = − 1.61). The contribution of motor and visuomotor factors to this difference cannot be ruled out. In contrast, performance on WASI Matrix Reasoning (total raw score, mean ± SD; SCA6: 21.9 ± 7.70, SE 2.57; controls: 26.5 ± 4.81, SE 1.70; mean difference − 4.61, 95% CI [− 11.24, 2.02]; p = 0.16; d = − 0.71) did not differ significantly between groups.
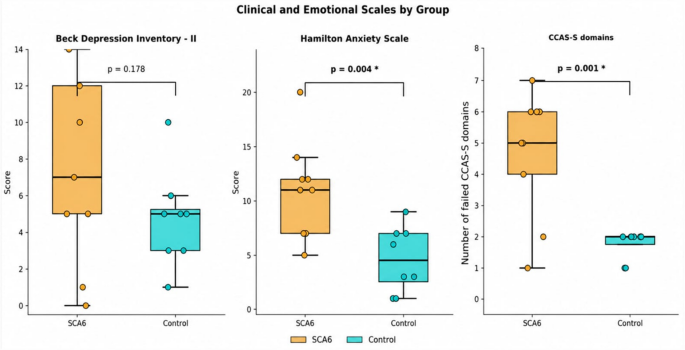
Emotional-Affective Symptoms and CCAS-SAnxiety symptoms, assessed with the HAM-A, were significantly higher in the SCA6 group (mean 11.00 ± 4.47, SE 1.49) than in controls (mean 4.63 ± 3.02, SE 1.07; mean difference 6.38, 95% CI [2.44, 10.31]; p = 0.004; d = 1.65). For reference, the conventional HAM-A severity thresholds are: 0–7, no anxiety; 8–14, mild anxiety; 15–23, moderate anxiety; ≥24, severe anxiety. Depressive symptoms, assessed with the BDI-II, were higher in the SCA6 group (mean 8.56 ± 7.16, SE 2.39) than in controls (mean 4.75 ± 2.66, SE 0.94; mean difference 3.81, 95% CI [− 1.88, 9.49]; p = 0.178; d = 0.69), although this difference did not reach statistical significance. The number of failed CCAS-S domains was higher in the SCA6 group (mean 4.67 ± 2.00, SE 0.67) compared with controls (mean 1.75 ± 0.46, SE 0.16; mean difference 2.92, 95% CI [1.36, 4.47]; p = 0.001; d = 1.95), with a higher number of failed domains and a shift toward more severe categories. Figure 1 illustrates these results.
Fig. 1
Clinical and emotional scales by group. Note. Boxplots display median, interquartile range, and individual data points for the Beck Depression Inventory-II (BDI-II), Hamilton Anxiety Scale (HAM-A), and the number of failed CCAS-S domains. Orange boxes represent the SCA6 group and cyan boxes represent the control group. Asterisks indicate statistically significant between-group differences (* p < 0.05)
In accordance with the original CCAS-S criteria, no control participant met criteria for definite CCAS. Among SCA6 patients, 77.8% were classified as definite CCAS, 11.1% as probable, and 11.1% as possible. In the control group, 75.0% were classified as probable and 25.0% as possible CCAS. Table 2 presents the CCAS-S classification in each group.
Table 2 CCAS-S classification (definite, probable, possible) in SCA6 and control groupsCorrelation AnalysesIn the SCA6 group, exploratory correlation analyses revealed significant associations between the number of failed CCAS-S domains and performance on the Boston Naming Test (r = − 0.721, p = 0.028; 95% CI [− 0.937, − 0.110]), Block Design (r = − 0.758, p = 0.029; 95% CI [− 0.953, − 0.114]), estimated IQ (r = − 0.698, p = 0.037; 95% CI [− 0.931, − 0.062]), Stroop Test (ρ = 0.758, p = 0.018; 95% CI [0.188, 0.946]), and Rey Figure Copy (ρ = −0.704, p = 0.034; 95% CI [− 0.932, − 0.076]).
Additional non-significant trends were observed for Corsi Blocks Backward (r = − 0.645, p = 0.060; 95% CI [− 0.917, 0.033]), Matrix Reasoning (r = − 0.652, p = 0.057; 95% CI [− 0.918, 0.022]), Picture Completion (r = − 0.610, p = 0.081; 95% CI [− 0.907, 0.091]), Rey Figure Memory (r = − 0.340, p = 0.371; 95% CI [− 0.819, 0.419]), RAVLT (r = − 0.329, p = 0.387; 95% CI [− 0.815, 0.428]), and HAM-A (r = − 0.531, p = 0.141; 95% CI [− 0.884, 0.206]). No relevant associations were identified for Hayling Test, cognitive flexibility (r = − 0.199, p = 0.637; 95% CI [− 0.792, 0.588]), inhibitory control (r = − 0.159, p = 0.707; 95% CI [− 0.777, 0.615]), Corsi Blocks Forward (r = − 0.409, p = 0.274; 95% CI [− 0.844, 0.350]), BDI-II (r = 0.329, p = 0.388; 95% CI [− 0.429, 0.815]), or Tower of London (r = − 0.722, p = 0.168; 95% CI [− 0.980, 0.442]). Given the small sample size (n = 9 for most analyses; n = 8 for Block Design, due to missing data), all estimates are sensitive to individual observations and should be interpreted with caution (Fig. 2).
Fig. 2
Correlations between CCAS-S and cognitive performance in SCA6. Note. Scatterplots showing relationships between the number of failed CCAS-S domains and neuropsychological measures in the SCA6 group (n = 9 for most analyses; n = 8 for Block Design, due to missing data). Pearson correlation coefficients (r) were applied for variables meeting normality assumptions (Shapiro–Wilk p > 0.05); Spearman's ρ was used for Stroop Test and Rey Figure Copy, which did not meet normality criteria. Dashed lines represent linear fit with 95% confidence intervals. Asterisks indicate statistically significant correlations (* p < 0.05). All analyses are exploratory
Both simple and partial correlations were computed between SARA scores and the number of failed CCAS-S domains. The simple correlation yielded ρ = 0.903 (p = 0.002; 95% CI [0.544, 0.982]; n = 8), indicating that greater motor severity was associated with a higher number of failed CCAS-S domains. The partial correlation controlling for disease duration remained high and statistically significant (ρ = 0.849, p = 0.016; 95% CI [0.27, 0.98]), suggesting that the association between motor severity and cognitive-affective impairment persists independently of disease duration. Figure 3 graphically illustrates the exploratory correlation results.
Fig. 3
Disease severity and the number of failed CCAS-S domains in SCA6. Note. Scatterplot showing the relationship between SARA scores and the number of failed CCAS-S domains in SCA6 patients (n = 8). Each point represents an individual participant, colored by disease duration. Dashed line represents linear fit with 95% confidence interval (shaded area). Simple and partial correlations were computed using Spearman's ρ. Simple correlation: ρ = 0.903, p = 0.002; 95% CI [0.544, 0.982]. Partial correlation controlling for disease duration: ρ = 0.849, p = 0.016; 95% CI [0.27, 0.98]. All analyses are exploratory
Comments (0)