Experimental animals
All mice were maintained at the University of Pennsylvania, Perelman School of Medicine, John Morgan animal facility with normal dark/light cycle, controlled room temperature and humidity conditions and had free access to food and water. All animal handling was under guidelines set forth by the School of Medicine’s Institutional Animal Care and Use Committee, approved protocol 807237. C57/BL6 males at an age range of 8–12 weeks were used for behavioral experiments. SNI/CFA and sham controls were housed in cages with five in each cage, with ample food and water. Animals were assigned to groups randomly and no animals were excluded from analysis.
Modeling chronic pain and von Frey testing
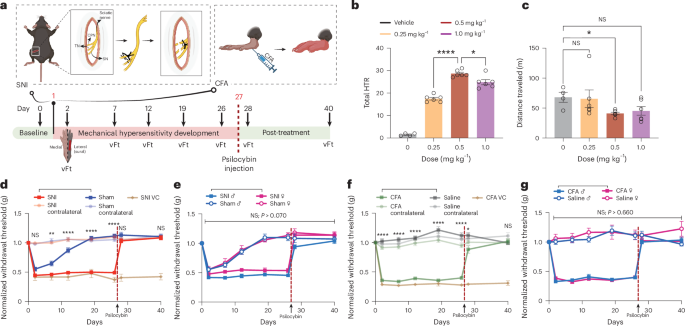
SNI of the sciatic nerve or sham operation (sham) was performed on C57BL/6 adult mice (8–12 weeks)51 In brief, surgeries were performed under strict sterile conditions. Mice were deeply anesthetized, and a small incision in the left thigh was made to expose the sciatic nerve. The tibial and common peroneal nerves were then axotomized/ligated, leaving the sural nerve intact. Care was taken to avoid any contact with or stretching of the intact sural nerve. Muscle and skin were closed in two layers. For sham surgery, the sciatic nerve was exposed but not ligated or cut. For inducing a model of inflammatory pain, undiluted CFA (Sigma-Aldrich, F5881) was subcutaneously injected unilaterally into the intraplantar surface of one hind paw in the mice (~80–100 µl), whereas control mice were injected with 0.9% saline solution (~80 µl). The von Frey test was used to assess the onset and maintenance of mechanical allodynia over time. In all animal groups, mechanical threshold was examined using an Electronic von Frey anesthesiometer (IITC, Life Science Instruments) that measures the precise minimum pressure at which paw withdrawal occurs. Specifically, a von Frey tip of suitable rigidity was attached to an electronic probe and used to apply an increasing pressure to the lateral plantar aspect (the sural nerve skin territory) of the hind paw. The anesthesiometer displays the pressure at which the mouse retracts from the von Frey tip. Three trials for paw withdrawal were recorded for each day tested and an average was reported. The von Frey test was performed during the light cycle by the same researcher.
Behavioral testsHTR assessment
HTR is described as a rotational/side-to-side head movement that spontaneously occurs following psychedelic administration41. HTR was assessed in individual animals in an Open Field chamber (25 × 25cm) for 30 min immediately after psilocybin injection. A 30-min session was recorded with a video camera and subsequently scored offline by a trained observer.
EPM
EPM consisted of two open arms without walls and two closed arms with walls. Time spent within open and closed arms was measured using ANY-maze software for a period of 5 min. Mice were placed in the center of an elevated maze, facing an open arm, to start the test. The maze is cleaned with ethanol and dried with paper towels before each test.
FST
A cylindrical glass tank (30 cm height × 20 cm diameter) was filled with water (maintained at 23–25 °C) to a height of 15 cm. Each tank is separated from an adjacent tank using a divider. Animals were lowered gently into water by tail and allowed to swim for 6 min. Only the last 4 min of the test were analyzed for periods of mobility, which were considered to be any movements other than those required to tread water.
OFT
The test was conducted in a 50 × 50 cm arena with a 25 × 25 cm central zone marked in the center. Before each experiment, the chamber was cleaned with 70% ethanol and allowed to dry completely. At the start of the trial, the animal was gently placed in the center of the arena, and behavioral recording using the ANY-maze system was initiated. During the 5-min session, the following parameters were measured: the number of entries into the central zone, the total distance traveled and the time spent in the central zone.
Light/dark box test
The test was conducted in a 45 × 30 × 27 cm box, divided into two compartments—one-third was a covered, dark chamber and the remaining two-thirds was an open, light chamber. The compartments were connected by a 7.5 × 7.5 cm opening, allowing the mouse to move freely between them. White lights were illuminated above the light chamber during the test. The time spent in the light and dark chambers was recorded using ANY-maze software over 10 min. At the start of the trial, the mouse was gently placed in the opening between the compartments, facing the dark chamber. Before each test, the arena was cleaned with 70% ethanol and thoroughly dried with paper towels.
TST
A hollow plastic cylinder is placed around the base of the mouse’s tail to prevent tail climbing. The mouse is then suspended by its tail using a long piece (~15 cm) of strong adhesive tape to the top of the testing system. The test lasts for 6 min but only the final 4 min of the test were analyzed for periods of mobility using ANY-maze software.
Rotarod test
Using the AccurRotor EzRod system, set up rotarod to accelerate from 1 to 45 rpm over 80 s for a total period of 180 s. Gently place the mouse on the rod and start the experiment. The trial begins with the start of the rotation and ends when a mouse falls off the rod. If a mouse clings to the rod and completes a full rotation (while hanging on to the rod), the time for the mouse is stopped and counts as a fall. The test is repeated for three trials and the average of the trials is used. If the mouse falls within the first 10 s of the test, the test is repeated. The latency to fall is then analyzed. Rod is cleaned with 70% ethanol and dried with delicate task wipes before each trial.
CPP
CPP apparatus consists of two chambers with distinct visual cues. One chamber with rectangular-shaped cues and another with circular cues on the walls of the chamber. The chambers are connected by a neutral third chamber with partitions on either side. During the preconditioning phase, the partitions were removed and the mouse was gently placed in the neutral chamber, allowing it to explore the different areas. Immediately after, time spent in each chamber over 15 min was recorded using ANY-maze software. The time spent in each chamber is then analyzed to verify that there is no preconditioning preference. Animals spending more than 80% or less than 20% of total time in one chamber are eliminated from the study. On the conditioning day, mice receive vehicle treatment (saline) and are then immediately placed in the appropriate pairing chamber for 30 min with no access to other chambers (using the partitions to block access). The mouse is then removed from the chamber. Four hours after vehicle treatment injection, the mouse is injected with psilocybin and immediately (within 2 min) is gently placed in the opposite pairing chamber for 30 min. Chamber pairings are counterbalanced (one mouse receives psilocybin in the rectangular chamber while another receives it in the circular chamber) to verify that no bias exists towards cues. On the test day (one day following the conditioning day), the mouse is gently placed in the neutral chamber. The partitions are removed such that the mouse has access to all chambers. Immediately after, time spent in each chamber over 15 min was recorded using ANY-maze software. Increased time spent in the psilocybin-paired chamber indicates a preference for the treatment.
Systemic and local drug delivery
In Fig. 1b,c, mouse head-twitch dose–response curves were recorded following intraperitoneal injection of psilocybin (Usona Institute) at doses of 0 mg kg−1 (saline), 0.25 mg kg−1, 0.50 mg kg−1 and 1.00 mg kg−1. In Fig. 1d–g, following the development of chronic pain, mice were treated with psilocybin on day 27 via a single i.p. (0.5 mg kg−1) or saline (same volume). In Fig. 6, SNI mice received either pimavanserin (Selleck Chemicals, S8183; 1 mg kg−1 i.p. dose) or WAY-100635 (Selleck Chemicals, S2663; 1 mg kg−1 i.p. dose) 30 min before psilocybin (0.5 mg kg−1). In Fig. 7b–m, SNI mice received either 8-OH-DPAT (Selleck Chemicals, S8447; 1 mg kg−1 i.p. dose), DOI (Cayman Chemical, 13885; 1 mg kg−1 i.p. dose) or DOI/DPAT (co-injected with DOI and DPAT; both 1 mg kg−1 i.p. dose).
For behavior experiments in Fig. 4, local psilocin injection (Cayman Chemical, 9003135; 1–500 μM mixed with Rhodamine 6G) to either ACC or spinal cord required a brief period of general anesthesia induced by isoflurane (4–5% for induction, 1–2% for maintenance). To ensure proper anesthetic depth, animal reactivity was assessed periodically by gently pinching the hind paws. For bilateral ACC injection, hair over the scalp was shaved, cleaned thrice with ethanol and a midline scalp incision was made using microsurgical tools. We next removed the soft tissue attached to the skull over ACC regions with fine forceps and a microblade. The mouse skull was immobilized by gluing (cyanoacrylate glue) it to a thin metal plate. Once the glue solidified (2 min), a high-speed microdrill was used to thin a small circular area ( ~ 0.5 mm in diameter) over the ACC bilaterally (+0.5–1.0 mm anterior to the bregma and 0.3–0.5 mm lateral to midline). Intermittent drilling and artificial cerebrospinal fluid (aCSF) immersion minimized heat-induced damage. After the bone thins to ~10–20 μm in thickness, a small bone tear was created with a beveled needle (27G) tip. At this point, a glass electrode filled with psilocin in aCSF (total volume of ~2 μl) was slowly injected into the cortex (depth 200–300 μm) via pressure application with a picospritzer (20 p.s.i., 50 ms per pulse, 1 Hz, 5–10 pulses). Upon completion of injection (~10–15 min), the electrode was rested for ~5–10 min followed by a slow retraction with burr hole closure via a small amount of cyanoacrylate glue. The procedure was repeated for the other hemisphere. The metal plate was then removed, scalp skin reapproximated and sutured.
For the intrathecal psilocin injections, hair overlaying the lower spine was shaved (3 × 3 cm area near base of tail) and cleaned thrice by ethanol. A 15-ml conical tube was placed under the abdomen of the mouse to expose a bigger area of the interspinous ligament, which was punctured by the needle to access the intradural space. Positioning the mouse on a 15-ml conical tube also made it easier to locate and grasp the iliac crest, which is identified by finding the two pits formed at the interface between the muscle and the hip bone. The injection site (L5–L6) was determined by identifying the most protruding spinal process (L6). Of note, injection at this level reduces concern for spinal injury as the spinal cord ends above this level. Next, the animal was grasped just above the hips and a psilocin-loaded Hamilton syringe (1–500 μM, total volume of ~5 μl mixed with Rhodamine 6G) was inserted between the groove of L5 and L6 at a 30° angle and to a depth of 0.5 cm. Once the needle successfully enters the intradural space, the mouse’s tail should move or flick. After observation of tail flick (confirmation of correct space), psilocin was slowly injected, and once completed, the syringe was left in place for 10 s to prevent backflow. The syringe was removed, and the animal was returned to its cage for monitoring.
Spinal cord collection and cFos immunohistochemistry
After perfusion, the entire mouse spinal column, including bone and muscles, was extracted by cutting along the length of the animal from the head to the tail. Small portions of the ribs were retained to help identify the thoracic region. The spinal column was cleaned by removing excess muscle from the spinal column using small scissors. Once cleaned to reveal the bone, the spinal column was placed in a dish with PBS under a magnifying lens. Using blunt tweezers to hold the cord, a blade was used to scrape off the remaining muscle until vertebrae and discs were visible. The lumbosacral region was identified (by counting vertebrae from the ribs - the reference for the thoracic region) and isolated. The spinal cord was extracted by using blunt tweezers to hold one end and pointed tweezers to carefully break the discs on the other end.
Lumbosacral spinal cord samples for subsequent cFos immunostaining were embedded in a 7% agar gel and sectioned in 1× PBS on a vibratome (Leica VT1000S) to obtain 30-μm-thick coronal sections. Intact sections were first blocked for 1 h at room temperature in blocking buffer (5% normal goat serum, 0.1% Triton X-100 in 1× PBS), followed by overnight incubation (~16 h) in primary cFos antibody solution (EnCor Biotechnology, RPCA-c-FOS; 1:1,000 rabbit polyclonal) at room temperature. Sections were washed 3× for 10 min each in 1× PBS before a 2 h room temperature incubation in secondary Alexa-Fluor 568 goat anti-rabbit antibody solution (Invitrogen by ThermoFisher Scientific, A-11011; 1:300). A final wash (3× for 10 min each in 1× PBS) was performed before slide mounting with DAPI Fluoromount-G (Southern Biotech, 0100-20).
Fixed sections were imaged on a fluorescence microscope (Keyence BZ-X810) at ×4 (Plan Apochromat, NA = 0.2) using a red cube filter (ex, 545/25 nm; em, 605/70 nm) or by confocal microscope (Thor Cerna confocal system) at ×10 (Plan Fluor, NA = 0.3) using a fixed wavelength 561 nm laser (Coherent OBIS). Confocal images were stitched using Fiji’s Grid/collection stitching plug-in52. Laminae I and II of the dorsal horn of the spinal cord were manually identified in each section using Fiji (version 2.9.0), and cFos-positive cells were identified in Fiji using a particle analyzer pipeline. Briefly, within each lamina I–II dorsal horn region of interest (ROI), the ROI was manually thresholded, converted to a mask, and then processed with a watershed algorithm to aid in the detection of individual cells. Binarized images were then processed with Fiji’s particle detector with size parameters 2–13 pixels² to calculate the number of cFos-positive cells within each ROI. Each plotted sample in Fig. 4d represents the average cell count from 3–6 ROIs in one animal.
Two-photon calcium imaging in awake animals
The genetically encoded calcium indicator GCaMP6f was used for calcium imaging of pyramidal neurons and interneurons in the cortex. GCaMP6f expression was performed using intracranial AAV injections in neonates. Pyramidal neurons were labeled using recombinant AAV9-CaMKII-Cre (Addgene, 105558; 10 nl of AAV per mouse) and AAV9-CAG-FLEX-GCaMP6f (Addgene, 100835; 100 nl of AAV per mouse). A glass micropipette (Drummond, 50,001,001 × 10) was pulled and beveled. A plunger was lightly oiled and inserted into the micropipette to pull the AAV mix. Subsequently, pups at postnatal days 1–2 were anesthetized by hypothermia (typically ~ 2–3 min on ice) and the micropipette was used (freehand) to penetrate the skin and skull and deliver ~200 nl of the virus mix. Medial PFC injection site was determined using landmarks—skull suture lines and head veins—as reference points. Imaging was performed in 1–2-month-old mice, using both sexes, after at least 4 weeks of AAV expression. Mice were group-housed in temperature and humidity-controlled rooms on a 12-h light/12-h dark cycle after injections.
In preparation for imaging, mice underwent a surgical procedure to attach a head holder mount and create an imaging window for two-photon microscopy. In brief, mice were anesthetized with a mixture of 100% oxygen at 2 l min−1 and 1–4% isoflurane. A heating pad was used to maintain the animal’s body temperature at approximately 37 °C. The mouse’s head was shaved, and its skull surface was exposed with a midline scalp incision. The periosteal tissue over the skull surface was removed without damaging the temporal and occipital muscles. A head holder consisting of two parallel metal bars was attached to the animal’s skull. In Cre-positive mice injected with AAV, <1% of mice were negative for GCaMP, suggesting off-target injection was a rare event. In positive mice, a small skull region (~2–4mm in diameter) located over the interfrontal suture was removed, and a round glass coverslip (approximately the same size as the bone being removed) was affixed to the skull with Loctite 495, followed by dental acrylic cement. This window enabled imaging of ACC (+0.5–1.0 mm anterior to the bregma and 0.1–0.3 mm lateral to midline). On recovering from surgical anesthesia, mice with head mounts were habituated daily (two sessions of 30 min with 15-min break) starting on postoperative day 1 in a custom-built body support to minimize potential stress effects of head restraining and imaging. No obvious distress was observed in habituated animals during imaging experiments. Mice tolerated surgery and stress related to the perioperative period as indicated by a 0–10% drop in weight. Imaging experiments were started on postoperative days 2–3 after window implantation.
On the day of imaging, awake mice were positioned in the custom head holder device under the two-photon microscope. In vivo two-photon imaging was performed with an Olympus DIY RS two-photon system (tuned to 910–920 nm) equipped with a Coherent Discovery NX laser. We minimized movement-associated image artifacts by head (secured metal head bars) and body (with a plastic sleeve) restraint on the imaging platform. Mice were head-restrained and imaged for <1 h in total, imaging across several regions in L2/3. To avoid potential interference from psilocin-induced activity-dependent plasticity, animals received a single local dose of psilocin via a small bone flap lateral to the cranial window, which was large enough to accommodate the tip of a glass electrode loaded with Rhodamine 6G and psilocin. Pyramidal neurons in ACC region were randomly chosen and recorded for 2-min sessions under awake conditions and once again after local application of psilocin. All experiments were performed using a ×20 Olympus objective (XLUMPLFLN; NA = 1.00, 2.0 mm working distance) immersed in aCSF, with ×2 digital zoom. Images were acquired at a frame rate of 2–4 Hz (2-μs pixel dwell time). Image acquisition was performed using Olympus Fluoview software and analyzed post hoc using ImageJ software version 2.1.0.
During recordings, motion-related artifacts were typically less than 2 µm. Vertical movements were infrequent and minimized by two metal bars attached to the animal’s skull (described above) and a custom-built body support. All time-lapse images from each field of view were motion-corrected and referenced to a single template frame using cross-correlation image alignment (TurboReg plugin for ImageJ version 2.1.0). ROIs corresponding to visually identifiable somas (pyramidal cells) were selected manually from the field of view. Imaging planes were acquired from L2/3 corresponding to cells positioned ~150–350 μm from the pial surface, respectively. Note that our neonatal injections produced sparse to moderate labeling of GCaMP6. As shown in Fig. 5, 5–20 neurons per L2/3 imaging region were common. A typical experiment would include 3–4 (randomly chosen) imaging regions per animal, yielding ~20–40 cells per animal. Somas that could be identified in all imaging sessions were included in the dataset.
In this study, we used GCaMP6f, an indirect reporter of neuronal spiking activity. All the pixels inside the ROI were averaged to obtain a fluorescence trace for each ROI. Background fluorescence was calculated as the average pixel value per frame from a region without GCaMP expression (blood vessel) and subtracted from the time-series fluorescence traces. The baseline (F0) of the fluorescence trace was estimated as the average of inactive portions of the traces (~2 s). We did not smooth the raw fluorescence trace (raw traces are presented throughout the paper in each figure). The ΔF/F0 (%) was calculated as ΔF/F0 = (F − F0)/F0 × 100. GCaMP6f can produce large fluorescence transients (20% ΔF/F) in response to single action potentials, and individual spikes within a burst result in stepwise increases in fluorescence. However, when neuronal firing rates are high, it becomes difficult to resolve the number of action potentials owing to the long decay time constant of GCaMP6 fluorescence. We found that there was a diversity in calcium traces of pyramidal cells, which likely reflects burst and nonburst firing. To compare neuronal activity among different cells with activity patterns, we performed an integrated measurement of a cell’s output activity over 2 min recording, termed area under the curve (%), as well as measuring peak fluorescence signal. In Figs. 4h and 7b, we report calcium activity changes following drug administration as response ratio, calculated as responsedrug/responsebaseline. To express the relative change from baseline, we computed the response ratio of −1, where positive values indicate an increase in activity relative to baseline and negative values indicate a decrease.
Statistics
Summary data were presented as mean ± s.e.m. Power analysis was used to determine sample sizes for Figs. 1 and 2, while sample sizes among other figures are similar to those reported in our previous publications53,54,55 and others9,56,57. Data distribution was assumed to be normal, but this was not formally tested. The interventions were not blinded, as nearly all experiments were carried out and analyzed by A.H. However, J.C., who was blinded to all experimental groups, conducted independent analyses on all datasets. Detailed statistical methods are included in Supplementary Table 1. Exact P values and common levels of significance (not significant, P > 0.05; *P < 0.05; **P < 0.01; ***P < 0.001) are reported in Figs. 1–7 and Supplementary Table 1. All statistical analyses were performed using GraphPad Prism.
Reporting summary
Further information on research design is available in the Nature Portfolio Reporting Summary linked to this article.

Comments (0)