
Remember me


This paragraph provides an overview of current 2H-MRS applications across organs and tissues in the body, focusing on the deuterated substrates used, their metabolic fate in different organs and conditions, and methodological approaches. To clarify substrate-specific pathways and to facilitate comparison across studies, this information is summarized in Tables 1 and 2, respectively.
Table 1 Deuterated compounds which have been used for 2H MRS in body applicationsTable 2 Overview of 2H-MRS applications across organs and tissues in the bodyLiverThe liver plays a key role in a multitude of metabolic processes, including the maintenance of glucose homeostasis. It acts as a reserve for systemic glucose. When blood glucose levels are high, the pancreas secretes insulin, which promotes hepatic glucose storage. In fact, hepatic glucose uptake accounts for ~25% of whole-body uptake in the postprandial state [16]. This glucose is stored in the form of glycogen. When blood glucose levels are low, the pancreas secretes glucagon, which promotes the conversion of glycogen back to glucose [17]. Additionally, the liver plays a key role in de novo lipogenesis (DNL), a metabolic pathway in which fatty acids are produced from carbohydrates.
These metabolic processes in the liver are disturbed in several pathological conditions associated with metabolic dysfunction. For example, in type 1 diabetes, the pancreas produces little to no insulin, leading to a dysregulation of glucose storage in the liver and contributing to hyperglycemia [18]. In type 2 diabetes, which is closely associated with metabolic syndrome and obesity, insulin resistance occurs in the liver and skeletal muscle, and the pancreas secretes insufficient insulin, also causing hyperglycemia [19]. Metabolic dysfunction-associated steatotic liver disease (MASLD), which also often develops in the context of metabolic syndrome and obesity, is currently the most widespread chronic liver disease, affecting almost 40% of adults [20]. MASLD is characterized by the accumulation of lipids in the liver plus at least one cardiometabolic risk factor [21]. The accumulation of lipids in MASLD is associated with an increased influx of fatty acids from the circulation, dysregulated fatty acid β-oxidation, and elevated DNL [22]. Elevated DNL has also been related to high consumption of fructose, which is a potent stimulator of DNL [23].
Currently, non-invasive and radiation-free methods to assess carbohydrate and lipid metabolism directly in the liver are limited, and current knowledge about these processes is often based on indirect measurements, for example, in plasma. Against this background, DMI emerges as a promising tool to gain new insights into hepatic metabolism in both healthy and disease conditions.
GlucoseIn addition to providing the first demonstration of DMI in the brain, De Feyter et al. [8] also applied the technique in both rat and human liver in the same paper. One to two hours after intravenous (rat) or oral (human) [6,6’-2H2]glucose administration, the 2H-MR spectra of the liver clearly showed a second peak besides the HDO peak, which was attributed to the combined signal of 2H-glucose and 2H-glycogen. However, unlike in the brain, labeling of downstream metabolites, such as glutamate and glutamine (combined referred to as Glx) and lactate, was not observed in the liver. To be able to quantify the contributions of 2H-glucose versus 2H-glycogen to the observed signal at 3.8 ppm, they conducted another study investigating the MR-visibility of 2H-glycogen [24]. Nuclear Magnetic Resonance (NMR) analysis of isolated liver glycogen of mice fed with [6,6’-2H2]glucose showed that the T2 of less than 2 ms of 2H-glycogen makes it practically NMR invisible. Thus, the peak measured at 3.8 ppm in the liver in vivo can be completely attributed to 2H-glucose.
The same study explored differences in hepatic glucose dynamics between intravenous and intraperitoneal infusion. During two hours, rats were infused either intravenously or intraperitoneally with 1.5 g/kg body weight [6,6’-2H2]glucose while simultaneously acquiring DMI scans of their livers at 11.7 Tesla (T). For intravenous administration, the glucose signal plateaued around the HDO level, while for intraperitoneal administration, the glucose signal continued to increase until the end of the experiment and became around twice as high as the HDO signal. The lower signal during intravenous injection could be explained by 2H-glucose uptake in other tissues before reaching the liver, whereas with the intraperitoneal route glucose first passes through the liver via the portal circulation, more closely reflecting physiological postprandial uptake. Additionally, the measured glucose uptake spatially varied within the liver, indicating that DMI may be able to map the vascularization of the liver [24].
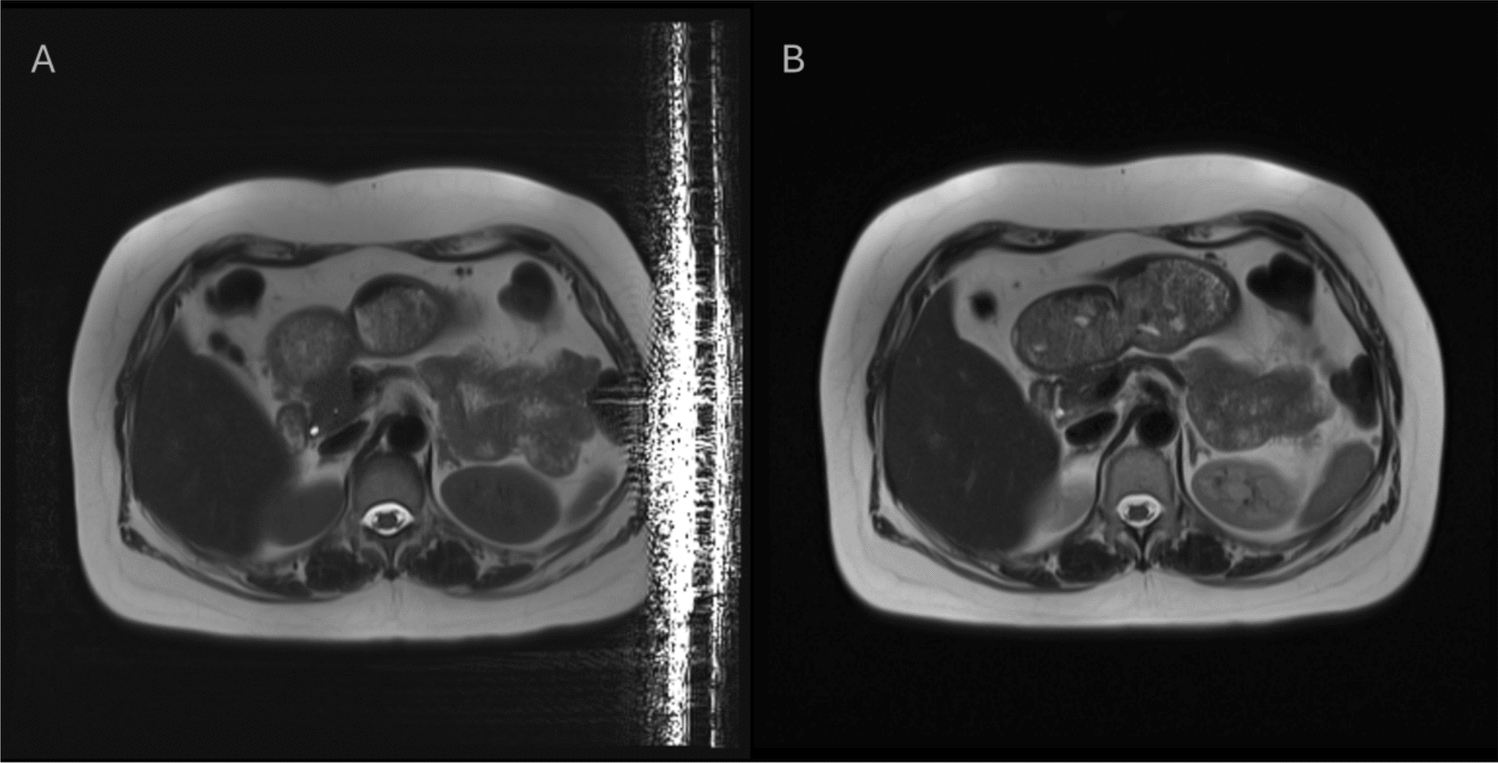
Building on these findings, subsequent studies by other groups applied dynamic DMI in the human liver to investigate hepatic glucose handling over time. In two ultra-high field (7 T) studies, subjects received an oral dose of 60 g of [6,6’-2H2]glucose, and DMI scans were performed up to ~ 3 h after intake, with a temporal resolution of 4 to 10 min, showing a maximum glucose signal in the liver around 60–100 min after intake [25, 26]. In one of those studies, a triple-channel 1H/2H/13C radiofrequency (RF) coil was employed, allowing interleaved measurements of liver glucose uptake with DMI and liver glycogen storage with 13C-MRS [26]. In the other study, a 2H body array was developed, enabling a large field of view and thereby allowing the simultaneous assessment of gastric emptying and hepatic (and renal) glucose uptake by DMI (Fig. 1) [25]. This is particularly relevant for metabolic diseases such as type 2 diabetes, in which gastric emptying abnormalities are common [27]. To translate this method to clinical field strength, Wodtke et al. [28] performed a similar study at 3 T. They showed that DMI of the abdomen is also feasible at lower field strength and obtained dynamic DMI data from stomach, duodenum, liver, and kidney. In most (early) in vivo DMI studies in humans, including brain studies, a dose of 0.75 g/kg body weight [6,6’-2H2]glucose has been used. Wodtke et al. [28] tested different doses of [6,6’-2H2]glucose and concluded that for abdominal applications of DMI at 3 T, the dose could be reduced to 0.5 g/kg body weight without compromising spectral quality or reliability of quantification.
Fig. 1
Dynamic 3D DMI data acquired of the human abdomen with a 2H body array, at baseline and 0–130 min after oral intake of [6,6’-2H2]glucose. Left: DMI voxel grid overlaid on coronal and axial T1-weighted images. Right: Time-resolved 2H spectra from voxels in the stomach (orange), liver (green), and kidney (blue). The large field of view enabled by the 2H body array allows simultaneous acquisition of metabolic information from these three organs. This figure was reproduced from Gursan et al. [25] under the Creative Commons CC BY license
Poli et al. [29] used DMI to investigate the differences in postprandial hepatic glucose metabolism between patients who underwent bariatric surgery and healthy controls. They specifically studied patients who had undergone a Roux-en-Y gastric bypass (RYGB), a procedure that bypasses most of the stomach and the duodenum, directing ingested food straight into the jejunum. This results in higher postprandial plasma glucose levels, stimulating insulin secretion. When the insulin response is excessive, plasma glucose levels may drop too low, which is called post-bariatric hypoglycemia, a condition that occurs in a small group of RYGB patients [30]. Since the liver plays such an important role in maintaining glucose homeostasis, Poli et al. hypothesized that the altered plasma glucose and insulin levels in RYGB patients are associated with altered hepatic glucose handling. Ten RYGB patients with mild post-bariatric hypoglycemia and ten healthy controls underwent dynamic DMI of the liver over the course of 2.5 h after oral administration of 60 g of [6,6’-2H2]glucose. In the RYGB patients, a sharp increase in hepatic 2H-glucose was observed, followed by a decrease, whereas healthy controls showed a more gradual increase and subsequent stabilization. Together with plasma concentrations of glucose and insulin and deuterium enrichment of plasma glucose, the DMI data were employed to create a mathematical model of postprandial hepatic glucose kinetics [31]. Modeling results indicated that, after 150 min, nearly all ingested glucose had reached the liver in RYGB patients but not in healthy controls, yet total hepatic disposal and first-pass extraction were comparable between the two groups.
FructoseUnlike glucose, hepatic uptake of fructose is largely independent of the liver’s energy status, and most fructose delivered through the portal vein is rapidly extracted by the liver [32]. Hendriks et al. [33] aimed to show the feasibility of using DMI in combination with intravenous administration of [6,6’-2H2]fructose (main resonance at 3.7 ppm) to measure uptake and metabolism of fructose in the mouse liver and compare these results to the uptake and metabolism of [6,6’-2H2]glucose. After bolus injection of the substrate, a more than two-fold higher initial uptake and faster decay was observed with fructose compared to glucose. With slow infusion of the substrate, lower signals were measured with fructose compared to glucose. Lastly, for both protocols, labeling of the water pool with deuterium was faster after fructose administration as compared to glucose. These results support the notion that fructose undergoes more extensive extraction and faster metabolic turnover in the liver than glucose.
AcetateBecause acetate feeds directly into the tricarboxylic acid (TCA) cycle, DMI with acetate may enable assessment of hepatic TCA cycle flux via Glx labeling, as opposed to glucose, with which Glx labeling is not observed in the liver. Ehret et al. [34] used the substrate [2,2’,2’’-2H3]Na-acetate to study alterations in TCA cycle flux in diet-induced fatty livers of rats compared to healthy controls. However, acetate administration proved challenging. Bolus injection was not physiologically tolerable, and slow infusion over an extended period (120 min) was necessary, which limited the analysis of downstream products. Nonetheless, 2H-Glx was detected in the livers of both healthy rats and rats with diet-induced fatty livers; however, no significant differences in hepatic acetate uptake or metabolic breakdown into Glx were found between the two groups.
Fatty acidsIn order to study both disturbances in carbohydrate and lipid metabolism in the fatty liver, Ehret et al. [35] applied DMI in combination with a bolus intraperitoneal injection of either [6,6’-2H2]glucose or [2H31]palmitic acid (a deuterated fatty acid) in healthy rats and rats with diet-induced fatty livers. There were no significant differences in hepatic glucose or palmitic acid uptake and metabolism between the two groups although the hepatic concentration of deuterated palmitic acid seemed to be higher in the rats with fatty livers. The lack of significant results was explained by the relatively mild degree of liver impairment in the study population, combined with a suboptimal time scale and small group size.
In addition to [2H31]palmitic acid, the shorter-chain fatty acid [2H15]octanoic acid has also been used to assess hepatic fatty acid metabolism with DMI. In a study by McLeod et al. [36], mice were fed either a standard chow diet (healthy controls) or a high-fat diet to induce MASLD. At baseline and after 8.5, 17, 24, and 36 weeks of diet, the animals received an intravenous injection of [2H15]octanoic acid and were imaged using 2H fast low-angle single shot (FLASH) and two-point Dixon sequences. Relative β-oxidation, defined as HDO produced per mg [2H15]octanoic acid per gram of liver tissue, declined more strongly over the 36-week diet period in the high-fat diet group compared with controls. These findings demonstrate that DMI with deuterated fatty acids can noninvasively capture alterations in hepatic fatty acid β-oxidation associated with MASLD progression.
2H2OThe liver not only takes up fatty acids from the circulation, but also synthesizes lipids de novo (DNL) from carbohydrates. The gold standard for DNL quantification relies on plasma-based measurements, which are indirect and may underestimate hepatic DNL when newly synthesized fatty acids remain stored within the liver. Although liver biopsy provides a more direct assessment, this invasive approach is not suitable for human studies. Gursan et al. [37] demonstrated the feasibility of directly detecting deuterium labeling in liver lipids in vivo using localized 2H-MRS after a week of 2H2O (heavy water) administration to rats. The in vivo measurements of 2H-lipid levels correlated strongly with ex vivo NMR estimates of hepatic DNL, supporting the potential of 2H-MRS as a quantitative, noninvasive method for assessing hepatic DNL in vivo. Very recently, this approach has also been demonstrated in humans, revealing a higher fraction of DNL-derived liver fat in South Asian participants compared with age- and body mass index-matched European subjects (preprint) [38].
TrimethylamineRecently, Dessau et al. [39] demonstrated the feasibility of using DMI to study hepatic metabolism of trimethylamine (TMA) to trimethylamine N-oxide (TMAO), a metabolite linked to cardiovascular, renal, and neurological disorders. Following oral administration of [2H9]TMA in mice, 2H-MR spectra acquired at 15.2 T revealed TMA signals in the stomach and, in females, clear TMAO formation in the liver and bladder, consistent with renal clearance. No hepatic TMAO was detected in males, in line with testosterone-mediated downregulation of the TMA-to-TMAO pathway. This study illustrates how DMI can provide spatially resolved insights into hepatic TMAO formation, although the small chemical shift difference between [2H9]TMA and [2H9]TMAO (~0.4 ppm) may limit spectral separation at clinical field strengths [39].
(Non-brain) tumorsMuch of the DMI research to date has been directed toward the characterization of tumor metabolism and the evaluation of tumor treatment response. Tumor metabolism can differ substantially from metabolism in healthy tissues. First, many tumors have an increased uptake of glucose compared to healthy tissue. In addition, glucose is often metabolized in a different manner. In healthy cells, glucose is predominantly oxidized via the TCA cycle and oxidative phosphorylation under aerobic conditions. This pathway leads to the production of Glx. When there is not sufficient oxygen present, healthy cells will switch to anaerobic glycolysis, which leads to the production of lactate. Many tumor cells favor the anaerobic glycolysis pathway regardless of the presence of oxygen, a phenomenon called the Warburg effect [40]. Lactate can promote angiogenesis and activate tumor growth pathways, and may be involved in multiple stages of carcinogenesis [41]. In addition to glucose, fructose metabolism also plays a key role in different types of cancer [42]. Cancer cells require an increased lipid supply to sustain proliferation, and fructose can be used as a precursor for lipid synthesis. Additionally, similar to glucose, the metabolism of fructose in tumor tissue is shifted toward the formation of lactate, supposedly supporting tumor growth [43]. Multiple studies have indicated that increased fructose uptake in tumors is associated with poor prognosis [42]. Lastly, tumor cells frequently exhibit increased choline uptake. Choline is a precursor of cell membrane phospholipids, and elevated choline uptake has been associated with high rates of cell membrane synthesis and cell proliferation [44].
Not only vital tumor tissue exhibits specific metabolic changes, but also necrotic tumor tissue shows altered metabolite conversions due to loss of cellular integrity. In studies using hyperpolarized 13C-MRS, it has been shown that the conversion of exogenously supplied fumarate to malate is much faster in necrotic tissue compared to vital tissue [45, 46]. Fumarate and malate are intermediates of the TCA cycle, with fumarase catalyzing the conversion of fumarate to malate. Under normal conditions, access of exogenously supplied fumarate, initially accumulating in the extra-cellular space, to the mitochondrial enzyme fumarase is limited, and the conversion to malate is slow. However, loss of plasma membrane integrity in necrotic cells increases the access of fumarate to fumarase, leading to a more rapid conversion to malate. Therefore, the conversion rate of fumarate to malate can serve as a marker of tumor necrosis in the assessment of therapy response.
Glucose[6,6’-2H2]glucose is the most commonly used deuterated glucose substrate in DMI research. When [6,6’-2H2]glucose enters anaerobic glycolysis, this will lead to the production of [3,3’-2H2]lactate, enabling the quantification of glycolytic flux. Several studies have applied DMI with intravenous injection of [6,6’-2H2]glucose in pre-clinical, non-brain tumor models. Using a 2H surface transmit–receive coil and non-localized 2H-MRS at 9.4 T, Kreis et al. [47] measured a maximum tumor glycolytic flux of 990 µM/min in a subcutaneous murine lymphoma model. Moreover, with dynamic 3D 2H-MRSI, it was shown that the glycolytic flux was spatially heterogeneous within the tumor and that the flux decreased already 48 hours after treatment, suggesting potential for early treatment response monitoring (Fig. 2). In orthotopic pancreatic cancer mouse models, dynamic 2H non-localized and 2D MRSI measurements at 15.2 T showed a much faster glucose build-up and a slower rate of lactate production compared to the study of Kreis et al. [47], resulting in a glycolytic flux of only 6 µM/min [48]. However, in healthy tissue, no lactate signals were detected at all, thus, the relatively slow conversion rate still distinguished the pancreatic tumor from its surroundings [48]. In mice with subcutaneously grown human renal carcinoma cells, dynamic 2H non-localized MRS and 3D MRSI at 11.7 T yielded similar time curves of deuterated glucose in tumor tissue compared to the study of Kreis et al. [47], but the highest measured deuterated lactate concentration was twice as low [49]. The latter could be explained by a lower [6,6’-2H2]glucose dose (1.3 g/kg in [49] versus 2 g/kg in [47]). Another possible explanation is that renal tumors remove lactate more efficiently. Collectively, these studies demonstrate that DMI with [6,6’-2H2]glucose reveals pronounced tumor-type specific differences in glucose metabolism, underscoring the importance of metabolic imaging in tumor characterization.
Fig. 2
Dynamic DMI data of a murine lymphoma model. Top: DMI field of view overlaid on anatomical axial images with the tumor indicated. Bottom: Glycolytic flux, as determined from the dynamic DMI data, before (left) and after (right) treatment. The glycolytic flux decreased within 48 h after treatment. This figure was reproduced from Kreis et al. [47] under the Creative Commons CC BY license
To overcome the limited sensitivity of [6,6’-2H2]glucose, Chang et al. [50] used perdeuterated [2H7]glucose as substrate in a mouse model of advanced melanoma. Consistent with studies using [6,6’-2H2]glucose, higher lactate signals were detected in tumor tissue compared to healthy (contralateral) tissue after administration of [2H7]glucose. In addition, faster labeling of the HDO pool was observed in tumor tissue, providing an even more sensitive marker of glycolytic flux. When equal doses of [2H7]glucose or [6,6’-2H2]glucose were administered, the tumor HDO signal measured 6 min post-injection was ~ 2.7-fold higher with [2H7]glucose, demonstrating its superior sensitivity. However, [2H7]glucose is more expensive than [6,6’-2H2]glucose, and future studies investigating optimal dosing and administration strategies for both compounds are needed to balance cost against SNR performance.
3-O-Methylglucose (OMG) is a non-metabolizable glucose analog; it is transported with the same transporters as glucose, but it cannot be further metabolized and is washed out from the body by the kidneys. A previous study on chemical exchange saturation transfer (CEST) MRI showed that OMG had a stronger and longer-lasting effect than glucose [51]. In addition, OMG has little to no effect on the hormone regulation of blood glucose levels, allowing for higher blood concentrations than regular glucose [52]. Hartmann et al. [53] synthesized deuterated OMG (3-O-C2H3-glucose) and performed in vivo DMI measurements to analyze the uptake and washout of OMG in a rat model of breast cancer bone metastases at 7 T. Compared with [6,6’-2H2]glucose, the 2H resonance of deuterated OMG (at 3.5 ppm) is better separated from the HDO peak, and the HDO and OMG peaks were clearly distinguishable in vivo, with a peak OMG concentration at 3 min after intravenous injection. However, in-depth analysis of tumor tissue versus healthy tissue could not be performed due to the inhomogeneous transmit profile and the small sensitive area of the surface coil.
PyruvatePyruvate is the end product of glucose metabolism through glycolysis. Since hyperpolarized 13C-MRS studies of tumor metabolism mostly use hyperpolarized [1-13C]pyruvate as substrate, Montrazi et al. [54] were inspired to investigate the use of [3,3’,3”-2H3]pyruvate for DMI and compare it with [6,6’-2H2]glucose. Directly after bolus injection of [3,3’,3”- 2H3]pyruvate in a pancreatic cancer mouse model, 2H-pyruvate and 2H-lactate signals became visible, but they faded very rapidly already ~5 min post-injection. The lactate signal was visible throughout the whole body and had only a weak sensitivity for the tumor, with a slightly higher concentration at the tumor rim. In contrast, 2H-lactate production after a bolus injection of [6,6’-2H2]glucose was clearly localized within the tumor, and the tumor 2H-lactate signal kept increasing for more than an hour post-injection. The 2H-glucose signal itself was mostly localized within the tumor rim, which could be explained by the high rate of glucose-to-lactate conversion inside the tumor. From this study, it was concluded that using glucose for the detection of pancreatic tumors with DMI is superior compared to pyruvate.
FructoseZhang et al. [55] tested the feasibility of using DMI with [6,6’-2H2]fructose to detect and localize tumors in a mouse model with subcutaneously implanted liver cancer cells and compared it with [6,6’-2H2]glucose. Lactate production rate was about two-fold lower for fructose than for glucose, and lactate signals were only detectable after summing the individual spectra over a 30 min time course. The HDO production rate was comparable for fructose and glucose, and it was proposed that HDO may serve as a sensitive indicator of substrate utilization in liver tumors. However, when using glucose, there is more wash in from HDO produced in other organs, whereas the HDO produced from fructose is more likely to reflect metabolism within the liver tumor itself, providing improved specificity.
CholineVeltien et al. [49] investigated whether DMI can be utilized to measure the uptake and conversion of [2H9]choline in subcutaneously grown human renal carcinoma cells in mice. The [2H9]choline peak could clearly be identified in the acquired spectra, and choline was found to be heterogeneously distributed throughout the tumors. Following infusion, the [2H9]choline signal peaked rapidly and then decayed only slowly, while gradually broadening, indicating conversion into other choline-containing metabolites. In addition, the study demonstrated that [2H9]choline and [6,6’-2H2]glucose can be administered simultaneously, with their respective signals clearly distinguishable. This combined approach could enable more comprehensive metabolic characterization of tumors by simultaneously probing choline and glucose metabolism.
FumarateStudies exploiting [2,3-2H2]fumarate in combination with DMI to assess tumor necrosis upon treatment have been performed by Hesse et al. [56,57,58]. First, they investigated the feasibility of using [2,3-2H2]fumarate and 2H-MRS as an alternative to previous 13C-MR studies employing hyperpolarized [1,4-13C2]fumarate [56]. They examined mouse models of lymphoma, colorectal carcinoma, and breast cancer with a dose of 1 g/kg body weight [2,3-2H2]fumarate, administered intravenously, both before and after drug treatment at 7 T. For all three tumor types, a significant increase in [2,3-2H2]malate concentration was measured post-treatment compared with pre-treatment. Although the labeled fumarate concentrations increased as well, the malate/fumarate ratio increased significantly after drug treatment. Since the resonances of fumarate (at 6.5 ppm) and malate (at 2.4 ppm) are well separated from HDO, the method should also be applicable at clinical field strengths and follow-up studies, therefore, focused on clinical translation.
Oral administration of [2,3-2H2]fumarate was evaluated and compared with the outcomes obtained following intravenous administration [57]. Oral dosing offers advantages, such as lower costs and increased patient comfort. In the treated murine lymphoma model, the maximum [2,3-2H2]malate signal detected within 65 min after [2,3-2H2]fumarate administration showed comparable SNR for oral and intravenous delivery. The increase in malate/fumarate ratio post-treatment was slightly reduced using oral administration compared with the intravenous method, yet the two methods yielded largely comparable results.
Another study explored the limits of the sensitivity of the method by lowering the concentration of intravenously administered [2,3-2H2]fumarate and by lowering the drug dose in the murine breast cancer model to induce differences in the extent of tumor cell death [58]. Even with the lowest drug dose, a measurable malate signal was obtained. The malate/fumarate ratio plateaued at tumor fumarate concentrations of 2 mM, which was achieved with administration of 0.3 g/kg [2,3-2H2]fumarate or more. The percentage of dead cells, as determined by histological assessment, was linearly correlated with the malate/fumarate ratio, indicating that this ratio provides a sensitive estimation of tumor cell death.
Together, these studies support the feasibility of using nontoxic fumarate concentrations, combined with oral administration, to enable translation of the method to clinical applications [57, 58].
2H2OBrender et al. [59] and Asano et al. [60] demonstrated that systemic administration of 2H2O combined with in vivo 2H-MR enables noninvasive visualization of tumor tissue based on deuterium accumulation. In both studies, the highest 2H signal was observed in tumor tissue compared to surrounding healthy tissue. Brender et al. [59] showed that a one-week 2H2O labeling period produced strong tumor contrast in colorectal and pancreatic cancer models at 9.4 T, and Asano et al. [
Comments (0)