Experimental protocol
We selected five adult epilepsy patients in pre-surgical workup to epilepsy surgery, with clinically defined temporal lobe epilepsy based on semiology and video electroencephalography. The patients had no structural abnormalities on clinical 3T MRI and showed hypometabolism on clinical 18FDG-PET (Table 1).
Table 1 Patients characteristicsThe study received ethical approval from the NedMec Medical Ethics Committee (NL83501.041.23) in Utrecht, the Netherlands. All procedures were conducted in accordance with the ethical principles outlined in the Declaration of Helsinki (1964) and its subsequent revisions. Written informed consent was obtained from all participants prior to their inclusion in the study.
DMI hardware and acquisition
DMI data were collected using a 7T MR system (Philips, Best, NL), featuring a home-built deuterium (2H) transmit coil integrated behind the bore of the scanner (60 cm diameter, 40 cm length) [20]. For signal reception, a head coil was used, consisting of eight trapezoid-shaped 2H receive loops (seven measuring 200 × 75–120 mm and one smaller frontal loop of 120 × 75–180 mm, all with 6 mm copper traces). This setup was combined with eight 1H transmit/receive dipole antennas [21], positioned at least 35 mm away from the 2H loops to minimize interference.
After the participants were placed in the scanner, B0 shimming was conducted, and both a T1-weighted image and a baseline DMI scan were acquired. Then, patients consumed 0.50 g/kg body weight of [6,6′-2H2]glucose dissolved in water (0.2 g/ml) within ~ 3-4 min [16] via a 1.5 m tube while they remained in the MR scanner. DMI data collection continued right after [6,6′-2H2]glucose consumption and lasted for approximately 100–120 min, depending on patient’s compliance.
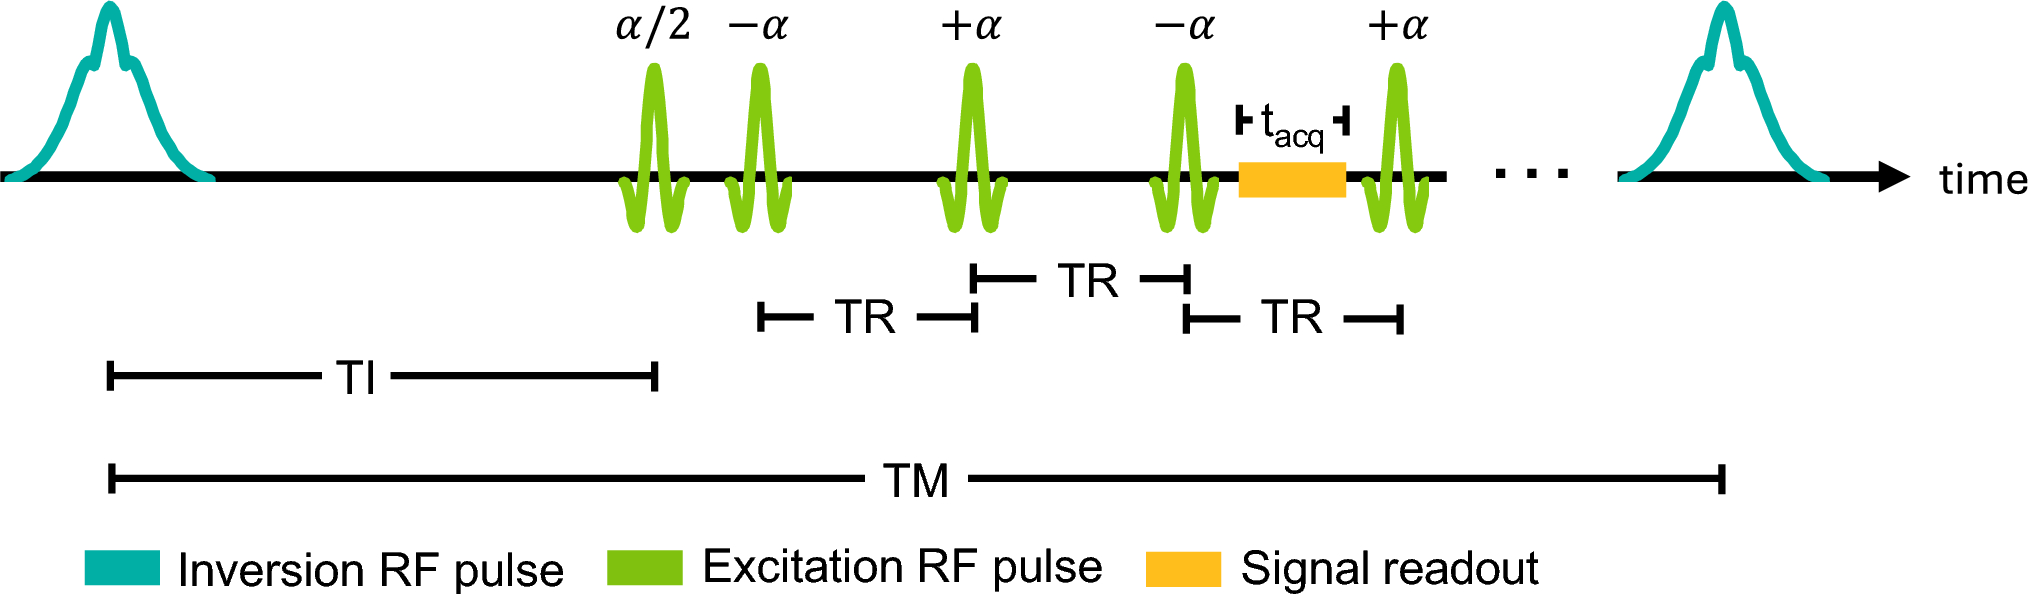
DMI data was acquired using a hamming-weighted 3D FID-MRSI sequence with a nominal voxel size of 12 × 12 × 12 mm3 (1.73 ml). Because of the acquisition-weighted spatial response function, this corresponds to an effective spherical volume of 3.84 ml, calculated following the methods described by Pohmann et al. [22]. Additional acquisition parameters were field of view (FOV): 240 × 180 × 216 mm3, repetition time (TR):100 ms, echo time (TE):1.82 ms, spectral bandwidth: 2800 Hz, 256 data points, four sample averages at k-space center, acquisition time: 11:44 min per scan).
Blood sampling and analysis
Participants fasted overnight and were scanned in the morning. Participants had an intravenous catheter placed in the median cubital vein. 5 ml blood samples were taken from the intravenous catheter every 10 min.
Plasma glucose levels were measured with a YSI glucose analyzer (2500 series, YSI, USA), and deuterium atom percent excess (APE) in plasma glucose was determined by gas chromatography-mass spectrometry [16, 32,33,34].
Post-processing
Data processing was done using in-house MATLAB scripts (Matlab R2021a, MathWorks, USA), including spatial Fourier transformation and phase correction. Data from the eight 2H receive channels were combined via Whitened Singular-Value Decomposition (WSVD) [23]. Following coil combination, the data underwent PCA-based denoising at each time point using a 5 × 5 × 5 patch size [24], after which a 5 Hz exponential apodization and spectral zero-filling to 2048 points were applied [25]. Signals from deuterated water (HDO), 2H-glucose (2H-Glc), and 2H-Glx were fitted with AMARES using Lorentzian line shapes [26], in two steps as described previously [27]. Only voxels in which the HDO signal from the baseline DMI scan (i.e., prior to [6,6-2H₂]-glucose administration) had a Cramèr–Rao Lower Bound (CRLB) below 10% were included in the analysis for all subsequent datasets. For 2H-Glc, 2H-Glx, and 2H-Lac, a CRLB threshold of 50% was applied at each individual time point. All signals were normalized voxel-wise to baseline HDO signal amplitude, assuming a HDO concentration of 17.2 mM. Signals were corrected for water content (grey matter: 0.78, white matter: 0.65, CSF: 0.97), number of deuterons, label loss, and T1-relaxation times [28,29,30].
In the ~ 1–6 months prior to the DMI scan, each patient underwent an 18FDG-PET scan as part of standard clinical care. The suspected epileptogenic region was defined as the hypometabolic region in each patient’s 18FDG-PET scan, manually delineated by an experienced 18FDG-PET interpreter. The 18FDG-PET was co-registered to the T1-weighted 7T image using SPM12. Average metabolite concentrations per timepoint were calculated in the PER and contralateral healthy tissue (contra-PER), and in two brain regions commonly involved in TLE: the hippocampus and temporal pole [31]. Anatomical masks for these regions were generated using AAL, Talairach Daemon, and IBA SPM 116 atlases in SPM12, then transformed from MNI to native space, split by hemisphere, and resampled to match DMI resolution. A voxel was assigned to a specific ROI if at least 25% of its volume overlapped with corresponding resampled mask. Additionally, mean 18FDG-PET uptake and mean metabolite concentrations per ROI were calculated over the final 4 timepoints per patient. This analysis of metabolite concentrations in the hippocampus and temporal pole was also performed on data of 5 previously published healthy volunteers (3 males/2 females, mean age 29 ± 7.8 years) (16), acquired using the exact same scanning protocol.
Only for visualization, the metabolic maps were upscaled per slice by a factor of five using bicubic interpolation, followed by Gaussian smoothing (σ = 1.2).
Statistical analysis
Mean plasma 2H-Glc APE and mean plasma glucose concentrations of [6,6′-2H2]glucose ingestion were calculated in all patients. The serial plasma glucose and plasma 2H-Glc APE were compared between patients over the entire scan duration using a General Linear Model with Repeated measures. To assess individual variability, a linear mixed model was used with patient as a random effect.
Statistical significance of time and brain ROI (PER, contra-PER, Hippocampus-PER, Hippocampus-contra, Temporal-PER, Temporal-contra) on brain 2H-Glc and brain 2H-Glx levels were analyzed using a two level Linear Mixed Model, with time and tissue type as fixed factors. For time as a factor, the dynamic changes in brain metabolite concentrations were compared in all tissue types. For the tissue type as a factor, the mean concentration of brain metabolites over all time points were compared between the different tissues. Average metabolite levels over the final 4 timepoints and 18FDG-PET uptake were compared between ROIs with ANOVA. 18FDG-PET uptake in PER vs. contra-PER was compared with a paired t-test.
If the results of the tests were significant, Bonferroni Post-Hoc tests were conducted.
Statistical significance was set at p < 0.05 for the above tests using IBM SPSS Statistics (version 27).


Comments (0)