
Remember me


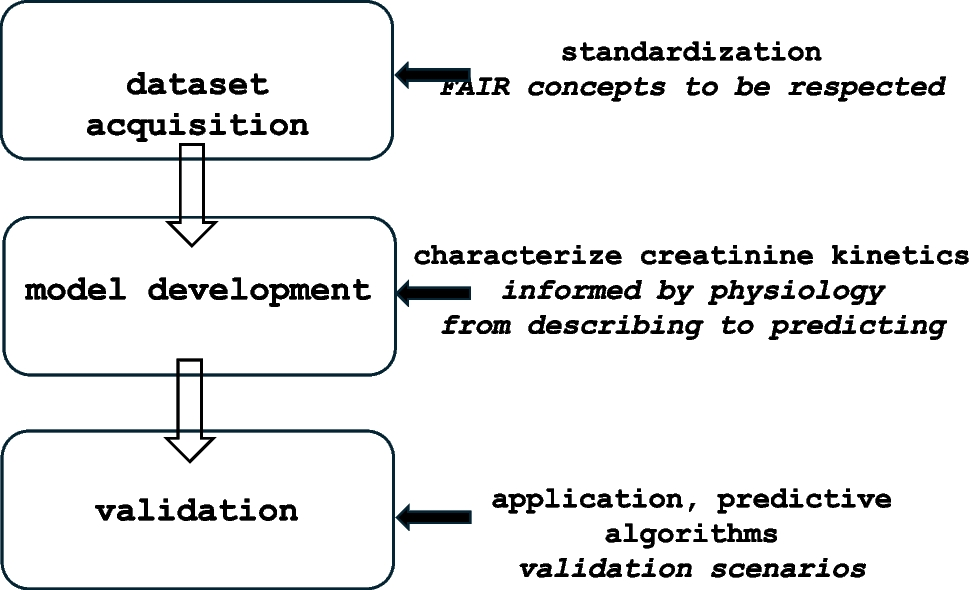
Similar to the workflow described for bilirubin patterns in postnatal life that converts clouds of bilirubin observations into a prediction model that informs clinicians on management decisions [8], a stepwise approach on sCr observations can be considered to inform clinicians on normal or abnormal trends over age in an individual newborn (Fig. 1).
Fig. 1
Workflow on the 3 consecutive components to convert serum creatinine observations into a predictive tool to guide clinical decision
Data collectionIn a first step, we have to collect sCr observations. Such data should preferably be longitudinal and generated by different units. In the best-case scenario, these datasets also contain information on covariates assumed to be relevant on Scr values, either maturational or non-maturational (see above). Based on publication recommendations on laboratory data in neonates, standardization should hereby be a priori considered. Such standardization should focus on clinical characteristics, bioanalytical information and data-analytic information [9]. For both covariate selection and standardization, multidisciplinary input (nephrology, neonatology, laboratory medicine, data science) is obviously warranted from this stage onwards.
The International Neonatal Consortium recently reillustrated that such datasets can be collected (Fig. 2), confirming patterns earlier described by, e.g., Rios et al. or Shihmabukuro et al., among others [2, 10, 11]. Applying the appropriate statistical analyses, nomograms and centile values can be generated to compare individual sCr observations, somewhat similar as to how we currently use growth and bilirubin charts [12, 13]. We can plot individual sCr observations and interpret trends for consecutive observations. However, would not it be even better to integrate prediction models in our clinical decision-making process, similar to the bilirubin example [8]? In that way, secondary prevention or intervention strategies can be better targeted to specific subjects or settings, as part of a precision medicine approach, by model development and Bayesian prediction approaches, like practices from the field of pharmacometrics.
Fig. 2
Nomograms for serum creatinine in different age categories in the first month of postnatal age [10]. a Thirty-seven to 44 weeks gestational age, b 32 to 36 weeks gestational age, c 28 to 31 weeks gestational age, or d 22 to 27 weeks gestational age. The lines represent the 2.5th, 25th, 50th, 75th, 90th, and 97.5th centile trend lines respectively. The number of subjects and number of observations is mentioned on top of each figure
Model development: from parsimonious description to Bayesian predictionKrzyzanski et al. applied a parsimonious population model approach in a dataset of 5095 sCr observations in 1080 subjects to characterize sCr patterns and its most relevant covariates [1]. They described the sCr patterns quite well over postnatal age (PNA) by a mathematical function where \(}_\) is the glomerular filtration rate at birth, \(}_\) is the time after birth at which 50% of GFRss is reached, GFRss the glomerular filtration rate at steady state, and \(\upgamma\) is the Hill coefficient.
$$\text\left(\text\right)=}_+\frac}_}-}_)\bullet }^}}_^+}^}$$
This function can be integrated into partial or full random effects pharmacokinetic models where sCr is a significant covariate and describes sCr patterns. This mathematical approach can also be used to develop Bayesian prediction models (prior distribution) and model expected trajectories [8], instead of plotting observations on a nomogram [10, 11]. An additional strength is that Bayesian updating (updating predictions with new lab values) can be performed, resulting in precision interpretation (probability distribution, like likelihood to develop AKI) tailored to the individual newborn.
Validation effortsOnce developed, validation efforts are needed to make these efforts clinically meaningful based on calibrated and reliable performance. Consequently, multidisciplinary collaboration is needed, since validation scenarios are crucial, and these scenarios should be informed by the clinicians involved. Validation scenarios refer to the prediction up to a given time interval (e.g. 24 h or 48 h) and based on a given number of earlier observations (e.g. 1 or 2 sCr) or specific events (e.g. asphyxia, nephrotoxin administration, cardiac bypass, sepsis) [8].
To illustrate its feasibility, a clinical decision tool to predict AKI generated by machine learning has been developed in the specific setting of asphyxiated neonates undergoing therapeutic hypothermia, with an open code and user interface that is freely available (https://github.com/NUBagciLab/Therapeutic-Hypothermia-Outcome-Classification) [14]. This serves as a case example, since this tool holds the potential to modulate treatment in a specific subgroup for secondary prevention strategies (like e.g. methylxanthines, fluid management) [14].
Comments (0)