
Remember me


Due its toxicity, lead has caused serious problems in human health and environmental pollution; thus, the use of lead-containing solder in electronic device packaging has been restricted by legislation . In the last few decades, aiming to replace lead-containing solders, great efforts have been dedicated to develop lead-free solder with respect to cost-effectiveness, wettability, melting point, corrosion resistance, and mechanical and electrical properties . A series of binary alloy solders, like Sn-Zn alloys , Sn-Cu alloys , Sn-Ag alloys , and Sn-Bi alloys , have been extensively investigated. Moreover, ternary and quaternary alloys have recently received considerable attention, and the Sn-Ag-Cu ternary alloy is considered as a promising candidate to substitute conventional lead-containing solder alloys .
Driven by the miniaturization of electronic devices and their widespread application in harsh environments such as high temperature and high humidity, the reliability of solder joints has become a major issue in practice . As far as lead-containing solders are concerned, the high quality of solder joints can be attributed to the formation of a continuous Pb layer, serving as a barrier layer to separate the intermetallics in solders from the substrate . In contrast to the barrier layer formed with lead-containing solder, the lead-free solder forms a compact interface between the intermetallics and the substrate without a barrier layer . The compact interface could result in poor resistance to high temperatures and thermal shocks. Therefore, high-lead solder remains the preferred choice for high-temperature applications at present .
In view of the fact that Ni and Pb belong to the same group in the periodic table of elements and have similar chemical and electronic properties , researchers have been intrigued to enhance the reliability of lead-free solder joints by Ni alloying. For instance, Zhang et al. observed that the corrosion resistance of Sn-Zn solder can be enhanced by alloying with Ni, Cr, Cu, or Ag; the higher corrosion resistance follows the order Ag < Cu < Cr < Ni . El-Taher et al. demonstrated that the ductility and the strength of Sn–3.0Ag–0.5Cu lead-free solders could be enhanced by Ni alloying . Although the beneficial effects of Ni alloying on the properties of lead-free solder have been demonstrated by these investigations, little attention has been paid to the effects of Ni alloying on the interfacial mechanical properties of lead-free solder joints.
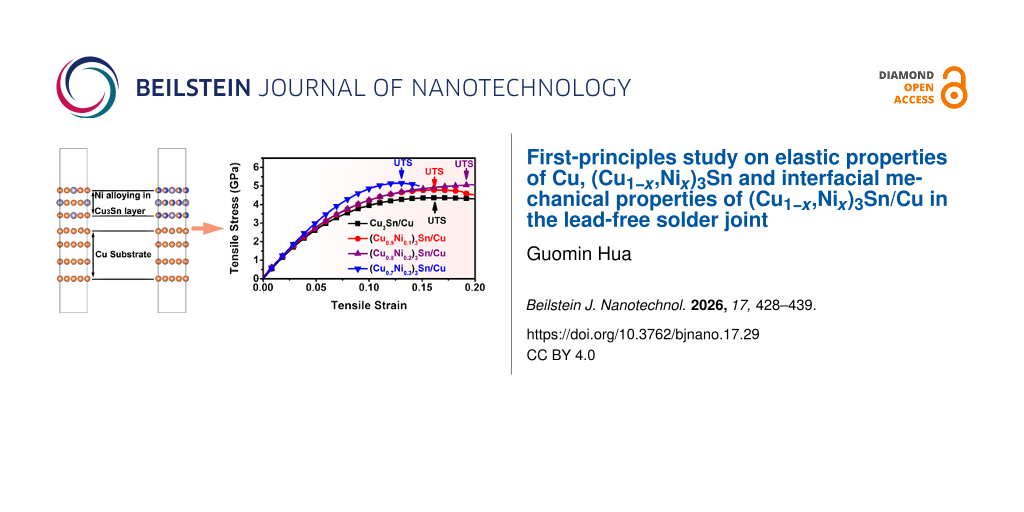
Considering the important role the interface between the intermetallics and the substrate plays in the strength and reliability of a solder joint, Gan et al. investigated the formation of Cu3Sn and Cu6Sn5 on a Cu substrate and determined the orientation relationship of ε-Cu3Sn/Cu interfaces as (001)ε//(111)Cu and [100]ε//[−110]Cu, that is, the interface was constructed by attaching the (001) facet of ε-Cu3Sn to the (111) facet of the Cu substrate and making the [100] axis of ε-Cu3Sn parallel to the [−110] axis of Cu substrate. Based on the orientation relationship of the ε-Cu3Sn/Cu interface, an attempt to reveal the effects of Ni alloying on the strength and toughness of (Cu1−xNix)3Sn/Cu interface has been made in this study. At first, the elastic properties of (Cu1−xNix)3Sn and Cu were calculated, followed by evaluation of the intrinsic ductility in terms of elastic moduli. Subsequently, the orientation-dependent Young’s moduli of Cu and (Cu1−xNix)3Sn were calculated. Finally, tensile modulus, ultimate tensile stress, work of adhesion, and interfacial toughness of (Cu1−xNix)3Sn/Cu were calculated based the interface model with the orientation relationship of (001)ε//(111)Cu and [100]ε//[−110]Cu; the underlying mechanisms responsible for the influence of Ni alloying on the work of adhesion and interfacial toughness are demonstrated.
MethodsIn this study, first-principles calculations within the framework of density functional theory were implemented by the ABINIT package . The norm-conserving pseudopotentials and Perdew–Burke–Ernzerhof generalized gradient approximation (GGA) of the exchange–correlation functional were adopted for the calculation. Regarding the calculations on the intermetallics (CuxNi1−x)3Sn, virtual crystal approximation (VCA) was used to construct the virtual atoms standing for the mixture of Cu and Ni atoms, namely, the pseudopotentials of the virtual atoms were constructed by :
![[Graphic 1]](https://www.beilstein-journals.org/bjnano/content/inline/2190-4286-17-29-i16.svg?max-width=637&scale=1.18182)
As demonstrated in previous studies , the VCA could significantly enhance the calculation efficiency without losing the accuracy by reducing the model size of the alloy systems. Considering the phase stability of (CuxNi1−x)3Sn , the content of Ni was set within the range from 0 to 30 atom %. As far as the calculations of the structure optimizations and elastic properties are concerned, a kinetic energy cutoff of 30 Hartree, a k-point mesh of 8 × 8 × 8 and a potential residual V(r) of less than 10−8 Hartree were used to achieve self-consistent convergence.
Based on the optimized crystal structures, the elastic constants of FCC Cu and orthorhombic (CuxNi1−x)3Sn were calculated by finite strain methods, where three and nine deformations were built for Cu and (CuxNi1−x)3Sn, respectively, related to the three and nine independent elastic constants corresponding to cubic and orthorhombic crystals, respectively . Strain magnitudes of −0.02, −0.01, 0.0, 0.01, and 0.02 were used to calculated the energy increments of the deformed cells. Via quadratic fits of the relation between the energy increments and the strains, the elastic constants C11, C12, and C44 for Cu and C11, C22, C33, C12, C13, C23, C44, C55, and C66 for (CuxNi1−x)3Sn were extracted. Based on the calculated elastic constants, bulk modulus, shear modulus, Young’s modulus, anisotropy, and Poisson’s ratio of Cu and (CuxNi1−x)3Sn were calculated according to Voight–Reuss–Hill bounds . Furthermore, from the calculated elastic constants, the orientation-dependent Young’s moduli of Cu and (CuxNi1−x)3Sn were calculated.
Based on the orientation relationship of Cu3Sn/Cu interfaces , namely, (001)ε//(111)Cu and [100]ε//[−110]Cu, the interface was constructed by adhering Cu and (CuxNi1−x)3Sn slabs. The Cu slab consisted of four atomic layers, the (CuxNi1−x)3Sn slab consisted of three atomic layers, and the thickness of the vacuum layer was 1 nm. Interfacial modulus, ultimate tensile stress, work of adhesion, and the interfacial toughness of (CuxNi1−x)3Sn /Cu interfaces were determined by a tensile test along the direction normal to the interface plane, that is, along the z-axis. During the tensile deformation, the strain along the z-axis was fixed; at the same time, the stresses along the x-axis and the y-axis were relaxed to less than 0.5 GPa. For the calculations on the interface structure, a kinetic energy cutoff of 30 Hartree, a k-point mesh of 4 × 4 × 1 and a potential residual V(r) of less than 10−8 Hartree were used to achieve self-consistent convergence.
Results and Discussions Elastic properties of Cu and (CuxNi1−x)3SnFigure 1a presents the optimized crystal structures of Cu and (CuxNi1−x)3Sn, where Cu crystallizes into the face-centered cubic (FCC) structure, and the (CuxNi1−x)3Sn crystallizes into an orthorhombic structure. Ni alloying in (CuxNi1−x)3Sn is represented by virtual atoms that substitute Cu atoms in Cu3Sn, the corresponding pseudopotentials of the virtual atoms were constructed by VCA . As listed in Table 1, the independent elastic constants C11, C12 and, C44 are 134.8, 109.5, and 51.5 GPa, respectively, for FCC Cu. The calculated elastic constants of Cu are consistent with the measured elastic constants . The independent elastic constants C11, C22, C33, C12, C13, C23, C44, C55, and C66 are 147.5, 165.0, 161.0, 82.9, 78.1, 79.4, 42.8, 47.4, and 45.5 GPa, respectively, for Cu3Sn. The calculated elastic constants of Cu3Sn are in good agreement with the elastic constants of Cu3Sn reported by Pang and coworkers . The dependence of the elastic constants of (CuxNi1−x)3Sn on the Ni content are presented in Figure 1b. It can be observed that the tensile elastic constants, C11, C22, and C33, and the orthogonal elastic constants, C12, C13, and C23, were significantly enhanced by the Ni alloying. In contrast, only slight improvements of the shear elastic constants, C44, C55, and C66, were obtained by Ni alloying.
![[2190-4286-17-29-1]](https://www.beilstein-journals.org/bjnano/content/figures/2190-4286-17-29-1.png?scale=2.0&max-width=1024&background=FFFFFF)
Figure 1: (a) Crystal structures of Cu and (CuxNi1−x)3Sn, where the virtual crystal approximation is adopted for (CuxNi1−x)3Sn, and the atomic models were plotted using VESTA . This content is not subject to CC BY 4.0. (b) The independent elastic constants, C11, C22, C33, C12, C13, C23, C44, C55, and C66 of (CuxNi1−x)3Sn, and the independent elastic constants, C11, C12, and C44 of Cu.
Table 1: Space groups, lattice constants, and independent elastic constants of Cu and (CuxNi1−x)3Sn; Voigt-type bulk modulus BV and Reuss-type bulk modulus BR; Voigt-type shear modulus GV and Reuss-type shear modulus GR. The data presented in parentheses are given for comparison.
Cu Cu3Sn (Cu0.9Ni0.1)3Sn (Cu0.8Ni0.2)3Sn (Cu0.7Ni0.3)3Sn space group Fm−3m Pmmn Pmmn Pmmn Pmmn lattice constants (Å) a = 3.665 (3.615)aaThe experimental lattice constants and elastic constants of Cu are cited from . bThe calculated lattice constants and elastic constants of Cu3Sn are cited from .
Using the calculated elastic constants of Cu and (CuxNi1−x)3Sn, the average bulk modulus, shear modulus, Young’s modulus, universal anisotropy, and Poisson’s ratio were calculated according to the Voigt–Reuss–Hill approximations . For FCC Cu, the Voigt-type bulk modulus BV and shear modulus GV, and the Reuss-type bulk modulus BR and shear modulus GR, can be calculated from C11, C12, and C44 as :
![[2190-4286-17-29-i1]](https://www.beilstein-journals.org/bjnano/content/inline/2190-4286-17-29-i1.svg?max-width=590&scale=1.18182) (1)
(1)
![[2190-4286-17-29-i2]](https://www.beilstein-journals.org/bjnano/content/inline/2190-4286-17-29-i2.svg?max-width=590&scale=1.18182) (2)
(2)
![[2190-4286-17-29-i3]](https://www.beilstein-journals.org/bjnano/content/inline/2190-4286-17-29-i3.svg?max-width=590&scale=1.18182) (3)
(3)For orthorhombic (CuxNi1−x)3Sn, the Voigt-type bulk modulus BV and shear modulus GV, and the Reuss-type bulk modulus BR and shear modulus GR, can be calculated from C11, C22, C33, C12, C13, C23, C44, C55, and C66 as :
![[2190-4286-17-29-i4]](https://www.beilstein-journals.org/bjnano/content/inline/2190-4286-17-29-i4.svg?max-width=590&scale=1.18182) (4)
(4)
![[2190-4286-17-29-i5]](https://www.beilstein-journals.org/bjnano/content/inline/2190-4286-17-29-i5.svg?max-width=590&scale=1.18182) (5)
(5)
![[2190-4286-17-29-i6]](https://www.beilstein-journals.org/bjnano/content/inline/2190-4286-17-29-i6.svg?max-width=590&scale=1.18182) (6)
(6)
![[2190-4286-17-29-i7]](https://www.beilstein-journals.org/bjnano/content/inline/2190-4286-17-29-i7.svg?max-width=590&scale=1.18182) (7)
(7)where
![[2190-4286-17-29-i8]](https://www.beilstein-journals.org/bjnano/content/inline/2190-4286-17-29-i8.svg?max-width=590&scale=1.18182) (8)
(8)The average bulk modulus B was calculated as the arithmetic average of BV and BR, that is, B = (1/2)(BV + BR). Likewise, the average shear modulus G was calculated by G = (1/2)(GV + GR). From the bulk modulus B and the shear modulus G, the Young’s modulus E and the Poisson’s ratio ν can be calculated as :
![[2190-4286-17-29-i9]](https://www.beilstein-journals.org/bjnano/content/inline/2190-4286-17-29-i9.svg?max-width=590&scale=1.18182) (9)
(9)
![[2190-4286-17-29-i10]](https://www.beilstein-journals.org/bjnano/content/inline/2190-4286-17-29-i10.svg?max-width=590&scale=1.18182) (10)
(10)The calculated bulk moduli, shear moduli, and Young’s moduli of Cu and (CuxNi1−x)3Sn are presented in Figure 2a and listed in Table 2. As for Cu, the calculated bulk modulus of 117.9 GPa, the shear modulus of 29.5 GPa, and the Young’s modulus of 81.8 GPa are consistent with the experimental results . Regarding the intermetallics (CuxNi1−x)3Sn, the bulk moduli, shear moduli, and Young’s moduli are greater than those of Cu, except the bulk modulus of Cu3Sn, which is less than that of Cu. At the same time, it can be observed that the bulk moduli, shear moduli, and Young’s moduli of (CuxNi1−x)3Sn increase with the increase of Ni content.
![[2190-4286-17-29-2]](https://www.beilstein-journals.org/bjnano/content/figures/2190-4286-17-29-2.png?scale=2.0&max-width=1024&background=FFFFFF)
Figure 2: (a) Bulk moduli, shear moduli, and Young’s moduli of Cu and (CuxNi1−x)3Sn; (b) universal anisotropies AU of Cu and (CuxNi1−x)3Sn; (c) Poisson’s ratios of Cu and (CuxNi1−x)3Sn; (d) ratios of bulk modulus to shear modulus, B/G, of Cu and (CuxNi1−x)3Sn. The green horizontal lines in (c) and (d) correspond to the boundaries of the ductile-to-brittle transition.
Table 2: Bulk modulus B, shear modulus G, Young’s modulus E, Poisson’s ratio ν; universal anisotropy AU; ductility index B/G, minimum Young’s modulus, Emin and the corresponding orientation [l1, l2, l3]min; as well as maximum Young’s modulus Emax and the corresponding orientation [l1, l2, l3]max. l1, l2, l3 are the direction cosines of the orientation axis. The data presented in parentheses are given for comparison.
Cu Cu3Sn (Cu0.9Ni0.1)3Sn (Cu0.8Ni0.2)3Sn (Cu0.7Ni0.3)3Sn B (GPa) 117.9 (140)a 105.9 (113.8)b 132.9 140.4 147.1 G (GPa) 29.5 (46.4)a 42.5 (46.7)b 47.9 50.5 53.4 E (GPa) 81.8 (112)a 112.3 (123.2)b 128.1 135.2 142.9 ν 0.384 (0.364)a 0.323 (0.319)b 0.339 0.339 0.338 AU 2.770 0.052 0.160 0.121 0.107 B/G 4.00 2.49 2.78 2.78 2.76 Emin (GPa) 36.7 93.9 103.9 116.8 124.9 [l1, l2, l3]min [1, 0, 0] [1, 0, 0] [1, 0, 0] [1, 0, 0] [1, 0, 0] Emax (GPa) 134.8 118.6 147.9 161.8 177.8 [l1, l2, l3]max [0.5774, 0.5774, 0.5774] [0.5918, 0.5137, 0.6212] [0.2978, 0.0000, 0.9546] [0, 0, 1] [0, 0, 1]aThe experimental elastic moduli and Poisson’s ratios of Cu are cited from . bThe experimental elastic moduli and Poisson’s ratios of Cu3Sn are cited from .
Moreover, using the calculated values of BV, BR, GV, and GR, the universal anisotropy index AU, developed by Ostoja-Starzewski et al., can be expressed as :
![[2190-4286-17-29-i11]](https://www.beilstein-journals.org/bjnano/content/inline/2190-4286-17-29-i11.svg?max-width=590&scale=1.18182) (11)
(11)Because the mechanical response of crystals to external loads strongly depends on the elastic anisotropy, the anisotropies of Cu and (CuxNi1−x)3Sn were evaluated by the universal anisotropy index, AU, which was calculated according Equation 11. In general, for locally isotropic crystals AU = 0. As the elastic anisotropy of the crystal increases, the value of AU will increase correspondingly. As shown in Figure 2b, the AU of Cu is 2.77. It indicates that Cu is intrinsically anisotropic, although Cu has a FCC structure. In contrast to the anisotropy of Cu, the AU of orthorhombic Cu3Sn is 0.052. This implies that Cu3Sn is locally elastically isotropic. After Ni alloying, the AU of (Cu0.9Ni0.1)3Sn increases to 0.160. With a further increase of Ni content, the AU of (CuxNi1−x)3Sn decreases from 0.121 in (Cu0.8Ni0.2)3Sn to 0.107 in (Cu0.7Ni0.3)3Sn. This demonstrates that the orthorhombic (CuxNi1−x)3Sn compounds are more isotropic than FCC Cu.
Besides elastic modulus and the anisotropy, the intrinsic ductilities of Cu and (CuxNi1−x)3Sn were evaluated using the parameters ν and B/G. Poisson’s ratio ν is defined as the ratio of the transverse strain to the longitudinal strain, and it characterizes the resistance of materials to distortion under mechanical load . The boundary of the ductile-to-brittle transition (DTB) can be identified as ν = 0.31 . As presented in Figure 2c, the calculated Poisson’s ratio of Cu is 0.384, which is in good agreement with the experimental value of 0.364 . It reveals that Cu is an intrinsically ductile metal. For Cu3Sn, the calculated Poisson’s ratio is 0.323, which is in the vicinity of the DTB boundary. This indicates that the intrinsic ductility of Cu3Sn is poor. However, by Ni alloying, the Poisson’s ratio of (Cu0.9Ni0.1)3Sn increases up to 0.339. With further increase of Ni content, the Poisson’s ratio of (CuxNi1−x)3Sn levels off about 0.339. In comparison with Cu3Sn, the increasing Poisson’s ratio indicates that improved ductility of (CuxNi1−x)3Sn can be achieved by Ni alloying.
In addition to Poisson’s ratio, another ductility index, that is, the ratio of bulk modulus to shear modulus, B/G, was adopted to evaluate the ductilities of Cu and (CuxNi1−x)3Sn. B/G is a measure of the plastic flow at the crack tip; low B/G values will lead to difficulties of plastic flow and, correspondingly, result in brittle behavior. In contrast, high B/G values give rise to an ease of the plastic flow and result in ductile behavior . In terms of B/G, the boundary of DTB can be identified as B/G = 2.4 . As presented in Figure 2d, the B/G value of Cu is 4.0, which is obviously higher than the DTB boundary of 2.4. This indicates the intrinsic ductility of Cu. The B/G value of Cu3Sn is 2.49, which is close to the DTB boundary of 2.4. It manifests the poor ductility of Cu3Sn. After Ni alloying of Cu3Sn, the B/G value of (Cu0.9Ni0.1)3Sn increases to 2.78. With the further increase of Ni content, the B/G of (CuxNi1−x)3Sn levels off about 2.78. The increasing values of B/G indicate that the ductility of (CuxNi1−x)3Sn is improved by Ni alloying. The ductility evaluations of Cu and (CuxNi1−x)3Sn in terms of Poisson’s ratio and B/G are mutually consistent.
Orientation-dependent Young’s moduli of Cu and (CuxNi1−x)3SnConsidering the critical roles of orientation-dependent elastic properties in the mechanical properties of interfaces , the orientation-dependent Young’s moduli of Cu and (CuxNi1−x)3Sn were investigated. Regarding FCC Cu, the orientation-dependent Young’s moduli,![[Graphic 2]](https://www.beilstein-journals.org/bjnano/content/inline/2190-4286-17-29-i17.svg?max-width=637&scale=1.18182) , along the directions ⟨hkl⟩ were calculated as :
, along the directions ⟨hkl⟩ were calculated as :
![[2190-4286-17-29-i12]](https://www.beilstein-journals.org/bjnano/content/inline/2190-4286-17-29-i12.svg?max-width=590&scale=1.18182) (12)
(12)For orthorhombic (CuxNi1−x)3Sn, the orientation-dependent Young’s moduli, ![[Graphic 3]](https://www.beilstein-journals.org/bjnano/content/inline/2190-4286-17-29-i18.svg?max-width=637&scale=1.18182) , along the directions ⟨hkl⟩ were calculated as :
, along the directions ⟨hkl⟩ were calculated as :
![[2190-4286-17-29-i13]](https://www.beilstein-journals.org/bjnano/content/inline/2190-4286-17-29-i13.svg?max-width=590&scale=1.18182) (13)
(13)where s11, s22, s33, s12, s13, s23, s44, s55, and s66 are the elements of the elastic compliance matrix. The elastic compliance matrix is the inverse of the elastic constant matrix. l1, l2 and l3 are the direction cosines of the ⟨hkl⟩ axes. Using the elastic compliance matrix, the three-dimensional (3D) oriented Young’s moduli of Cu and (CuxNi1−x)3Sn were calculated using Equation 12 and Equation 13, respectively. Maximum and minimum of Young’s moduli and the corresponding orientations are listed in Table 2. As shown in Figure 3a, the orientation-dependent Young’s moduli of FCC Cu exhibit a star-shaped surface, and the maximum Young’s modulus is oriented along the body diagonal, that is, the ⟨111⟩ direction. In contrast, as shown in Figure 3b–e, the orientation-dependent Young’s moduli of (CuxNi1−x)3Sn exhibit a spheroidal surface. After Ni alloying, the spheroidal surfaces of (CuxNi1−x)3Sn are expanded. As the Ni content increases, the direction of the maximum Young’s modulus changes from off the z-axis in Cu3Sn to along the z-axis in (Cu0.9Ni0.1)3Sn, (Cu0.8Ni0.2)3Sn, and (Cu0.7Ni0.3)3Sn. The shapes of the 3D oriented Young’s moduli demonstrate that the anisotropy of FCC Cu is higher than those of orthorhombic (CuxNi1−x)3Sn. The anisotropies of Cu and (CuxNi1−x)3Sn revealed by the 3D orientation-dependent Young’s moduli are consistent with the anisotropies measured by the universal anisotropy AU.
![[2190-4286-17-29-3]](https://www.beilstein-journals.org/bjnano/content/figures/2190-4286-17-29-3.png?scale=2.0&max-width=1024&background=FFFFFF)
Figure 3: 3D surfaces of oriented Young’s moduli for (a) Cu, (b) Cu3Sn, (c) (Cu0.9Ni0.1)3Sn, (d) (Cu0.8Ni0.2)3Sn, and (e) (Cu0.7Ni0.3)3Sn. 2D profiles on the (110) plane of oriented Young’s moduli for (f) Cu, (g) Cu3Sn, (h) (Cu0.9Ni0.1)3Sn, (i) (Cu0.8Ni0.2)3Sn, and (j) (Cu0.7Ni0.3)3Sn; the orientations of the maximum Young’s moduli in the 2D profiles are denoted by the red lines.
By cutting the 3D oriented Young’s moduli in the (110) plane, along the solid lines shown in Figure 3a–e, specific magnitude and direction of the maximum Young’s moduli of Cu and (CuxNi1−x)3Sn were analyzed. The magnitude of the maximum Young’s modulus Emax is given by ![[Graphic 4]](https://www.beilstein-journals.org/bjnano/content/inline/2190-4286-17-29-i19.svg?max-width=637&scale=1.18182) . The 2D Young’s modulus for Cu is shown in Figure 3f. It can be seen that the orientation-dependent Young’s modulus of Cu shows a fourfold petal-shaped profile, the maximum Young’s modulus of 134.8 GPa is along the ⟨111⟩ direction. As shown in Figure 3g, the maximum Young’s modulus of Cu3Sn is 118.6 GPa with orientation close to the ⟨111⟩ direction. Figure 3h–j shows that the maximum Young’s moduli of (Cu0.9Ni0.1)3Sn, (Cu0.8Ni0.2)3Sn, and (Cu0.7Ni0.3)3Sn are 147.9, 161.8, and 177.8 GPa, respectively, with orientation close to the ⟨001⟩ direction. These results reveal that the Ni alloying in (CuxNi1−x)3Sn will not only increase the magnitude of the maximum Young’s modulus, but also turns the orientation of the maximum Young’s modulus from off the z-axis to along the z-axis.
. The 2D Young’s modulus for Cu is shown in Figure 3f. It can be seen that the orientation-dependent Young’s modulus of Cu shows a fourfold petal-shaped profile, the maximum Young’s modulus of 134.8 GPa is along the ⟨111⟩ direction. As shown in Figure 3g, the maximum Young’s modulus of Cu3Sn is 118.6 GPa with orientation close to the ⟨111⟩ direction. Figure 3h–j shows that the maximum Young’s moduli of (Cu0.9Ni0.1)3Sn, (Cu0.8Ni0.2)3Sn, and (Cu0.7Ni0.3)3Sn are 147.9, 161.8, and 177.8 GPa, respectively, with orientation close to the ⟨001⟩ direction. These results reveal that the Ni alloying in (CuxNi1−x)3Sn will not only increase the magnitude of the maximum Young’s modulus, but also turns the orientation of the maximum Young’s modulus from off the z-axis to along the z-axis.
In the following, the mechanical properties of (CuxNi1−x)3Sn/Cu interfaces were investigated. As shown in Figure 4a, the interface structure of (CuxNi1−x)3Sn/Cu was modelled as a (CuxNi1−x)3Sn slab with three atomic layers, a Cu slab with four atomic layers, and a vacuum layer with thickness of 1 nm. The adjacent atomic layers of Cu slab and (CuxNi1−x)3Sn slab were free, and the remaining atomic layers of Cu slab and (CuxNi1−x)3Sn slab were fixed. The thickness of the interface layer was defined as thickness of free atomic layers, a. Tensile stress was applied along the direction normal to the interface plane, and the relationship between tensile stress and tensile strain of (CuxNi1−x)3Sn/Cu interfaces were calculated (Figure 4b). The tensile modulus, Etensile, was determined as the ratio of the tensile stress to the corresponding strain in the tensile strain range from 0.00 to 0.03. As shown in Figure 4c, the tensile moduli of (CuxNi1−x)3Sn/Cu interfaces increase from 60.3 GPa in Cu3Sn/Cu to 76.7 GPa in (Cu0.7Ni0.3)3Sn/Cu. The increase of the tensile modulus can be attributed to the fact that the Young’s moduli of (CuxNi1−x)3Sn along the ⟨001⟩ direction increase with Ni content.
![[2190-4286-17-29-4]](https://www.beilstein-journals.org/bjnano/content/figures/2190-4286-17-29-4.png?scale=2.0&max-width=1024&background=FFFFFF)
Figure 4: (a) Orientation relationship and structure of (CuxNi1−x)3Sn/Cu interfaces; the atomic models were plotted using VESTA . This content is not subject to CC BY 4.0; (b) tensile stress vs tensile strain curves of (CuxNi1−x)3Sn/Cu interfaces; (c) tensile moduli Etensile of (CuxNi1−x)3Sn/Cu interfaces; (d) ultimate tensile strengths UTS and tensile strains at UTS of (CuxNi1−x)3Sn/Cu interfaces; (e) work of adhesion Wad of (CuxNi1−x)3Sn/Cu interfaces; (f) interfacial toughness of (CuxNi1−x)3Sn/Cu interfaces.
From the tensile stress vs tensile strain cur
Comments (0)