
Remember me
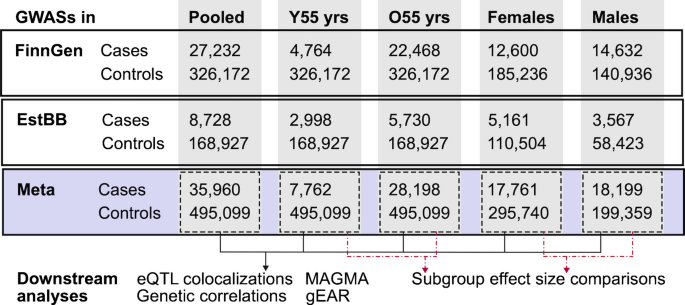


FinnGen is a collaborative project launched in 2017 [29], aiming at advancing human health through genetic research. This initiative harnesses genome data collected from a nationwide network of Finnish biobanks, which are linked with digital health records from various national registries, including hospital discharge, death, cancer, and medication reimbursement databases. The project covers approximately 10% of the Finnish population. FinnGen Data Freeze 9 data utilized in the study included 27,232 SHNL cases and 326,172 controls (Table S3).
The Estonian Biobank (EstBB) is a longitudinal biobank in Northern Europe that holds genotype and phenotype data for 20% of the Estonian adult population [30]. At recruitment, participants signed a consent allowing follow-up linkage of their electronic health records (EHR). Health records at EstBB are extracted from the data provided by regional hospitals, national registries, and the Estonian Health Insurance Fund, a national administrative database that pools detailed and individual-level billing data for all health care services as well as digital prescription information. The activities of the EstBB are regulated by the Human Genes Research Act, which was adopted in 2000 specifically for the operations of the EstBB. Individual-level data analysis in the EstBB was carried out under ethical approval number 1.1–12.1/624 from the Estonian Committee on Bioethics and Human Research (Estonian Ministry of Social Affairs). In this study, 177 655 participants from EstBB were included, 8728 cases and 168 927 controls (Table S3).
Phenotype DescriptionsWe identified SNHL cases that were required to have an entry of The International Classification of Diseases, Tenth Revision (ICD-10): H90.3, H90.4, H90.5, H91.1. Participants without a record of these ICD codes were classified as controls. In addition, the individuals with the records of the following codes were excluded from the analyses: H65.4, H66.1, H66.2, H66.3, H67.0*A18.6, H67.0*A38, H67.1*, H67.1*B05.3, H68.0, H68.1, H70.0, H70.1, H70.2, H70.8, H70.9, H71, H73.1, H73.8, H73.9, H74.0, H74.1, H74.2, H74.3, H74.4, H74.8, H74.9, H75.0*, H75.0*A18.0, H75.8*, H80.0, H80.1, H80.20, H80.28, H80.8, H80.9, H81.0, H83.0, H83.1, H83.2, H83.3, H83.8, H83.9, H90.0, H90.1, H90.2, H90.6, H90.7, H90.8, H91.0#, H91.2, H91.3, H91.8, H91.9, H93.3, H93.8, H93.9, H94.0*, H94.0*A52.1, H94.8*, H95.0, H95.1, H95.8, H95.9, Q16.0, Q16.1, Q16.2, Q16.3, Q16.4, Q16.5, Q16.9, Q17.2, Q17.3, Q17.4, Q17.8, Q17.9, D33.30. Overall, the meta-analysis focusing on the general population consisted of 35,960 SNHL cases and 495,099 controls (Table S3).
In the sex-stratified analyses, participants were stratified to males (18,199 cases in the meta-analysis) and females (17,761 cases in the meta-analysis) and were compared to same-sex controls (the respective numbers of controls were 199,359 and 295,740). In the age-stratified analyses, the cases were classified into two groups: those who were diagnosed before the age of 55 (7762 cases) and those who were diagnosed at the age of 55 or after (28,198 cases). Earlier criteria for age-related hearing loss often used 60 years as the cut-off age, whereas more recent recommendations suggest considering screening around age 50 [31]; therefore, we selected 55 years as a threshold that better reflects the recent recommendations while remaining within the commonly reported onset range of approximately 55–65 years [32]. The control group was not stratified by age in the age-stratified analyses (Ncontrols = 495,099 in the age-of-onset-stratified analysis). The number of participants in each studied cohort is available in Table S3 and in the study overview given in Fig. 1.
Fig. 1
Overview of the study design for the SNHL GWAS. The schematic illustrates the datasets used and the subsets analyzed in the study
Genotyping, Imputation, and Quality ControlIn FinnGen, genotyping of the samples was performed using Illumina and Affymetrix arrays (Illumina Inc., San Diego, and Thermo Fisher Scientific, Santa Clara, CA, USA). Sample quality control (QC) was performed to exclude individuals with high genotype missingness (>5%), ambiguous gender, excess heterozygosity (±4SD) and non-Finnish ancestry. Regarding variant QC, all variants with low Hardy–Weinberg equilibrium (HWE) p-value (< 1e-6), high missingness (>2%) and minor allele count (MAC) < 3 were excluded. Chip genotyped samples were pre-phased with Eagle 2.3.5, with the number of conditioning haplotypes set to 20,000. Genotype imputation was conducted by using the Finnish population-specific SISu v3 reference panel with Beagle 4.1 (version 08Jun17.d8b) as described in the following protocol: dx.doi.org/https://doi.org/10.17504/protocols.io.nmndc5e. In post-imputation QC, variants with imputation INFO<0.6 were excluded.
Genotyping of the samples from the Estonian Biobank was conducted in the Core Genotyping Lab of the Institute of Genomics, University of Tartu, using the following Illumina arrays: GSAMD-24v1, GSAMD-24v2, ESTchip-1_GSAv2-MD, and ESTchip-2_GSAv3-MD. Quality control was conducted according to best practices (exclusion of individuals with call rate < 95%, with a mismatch between genotype and phenotype sex and who deviated ±3SD from the samples heterozygosity rate mean; exclusion of SNVs with call rate < 95%, HWE p < 1e-4, MAF < 1%). Samples were pre-phased with Eagle v2.3 with the number of conditioning haplotypes set to 20,000, and genotype imputation was carried out with Beagle v.28Sep18.793 using an Estonian-specific reference panel [33]. Prior to imputation, variants with minor allele frequency (MAF) <1% and indels were removed. Further, EstBB samples were combined with the 1000 genomes phase 3 dataset for ancestry analysis. Genetic principal components were calculated using a subset of quality-controlled and pruned genotyped SNPs. This was further used to identify and remove samples that deviated from the main cluster.
GWASs and Meta-analysesGWASs were conducted with REGENIE (v2.2.4) using an additive model [34]. The analyses were adjusted for age, sex, and the first 10 genetic principal components, and in FinnGen, also for the genotyping batch. In the sex-stratified analyses, sex was not included as a covariate.
The METAL software (v.2011-03-25) [35] was used to do inverse-variance weighted fixed-effect meta-analyses of the GWAS results from FinnGen and the Estonian Biobank. Variant data from the Estonian Biobank were converted from hg19 to hg38 prior to the meta-analysis. A total of 14,848,072 genetic variants available through both FinnGen and EstBB were included in the meta-analysis.
Characterization of the Association SignalsWe defined a locus as a window of 1 MB (±500,000 bases from the association lead variant) containing at least one variant associated with SNHL at P < 5 × 10⁻⁸. By manually annotating every gene within the loci and prioritizing those according to a relevant biological function using literature and database resources such as Genbank [36] and Uniprot [37], we were able to identify potential candidate genes for the loci that had not been linked to SNHL in previous studies.
Functional AnnotationsWe employed MAGMA v1.10 (Linux) [38] for conducting gene-based and gene-set analysis on SNHL data. The input file utilized in the analysis comprised meta-analyzed results from the SNHL GWAS conducted in the general population. The 1000 Genomes project European population was used as a reference sample for LD corrections. The variants were mapped to gene locations according to human genome build 38 (NCBI38.gene.loc). To better capture variants in the regulatory regions, we added a 35 kb window upstream and a 10 kb window downstream of the genes. Subsequently, the association signals of the variants were aggregated to gene-level statistics. The gene-set level analysis used the 2023.2 version of the MSigDB gene set file, comprising 34,494 curated gene sets and gene ontology (GO) terms.
eQTL ColocalizationsGene expression and observed SNHL associations were colocalized using the “coloc” R-library function ‘coloc.abf’ [39]. For every SNHL-associated locus, colocalization was evaluated for every gene within a 1 MB window from the association lead variant. From the GTExportal (https://www.gtexportal.org/home/datasets), we downloaded variant-gene expression associations (GTEx v8, accessed on 19/05/2022) for the analysis. We selected the following tissues for the analysis: whole blood as a widely used reference tissue; brain (cerebellum, cortex, and hippocampus) and tibial nerve to assess alignment with neuronal expression relevant to auditory signaling; and adipose tissue (subcutaneous and visceral) to capture regulatory variation related to metabolic and inflammatory processes that may contribute to ARHL. We considered posterior probabilities for a shared causal variant ≥ 0.8 as a limit for significant results [40].
To gain a better understanding of the gene expression of potential candidate genes in tissues relevant to SNHL, we reviewed gene expression profiles for 24 identified potential candidate genes from the gEAR [41], using the Human inner ear atlas datasets [42]. We did not identify potential candidate genes for loci located in the HLA region, so no genes from the region were included in the gene expression analysis.
Genetic CorrelationsGenetic correlations were computed using the LDSC software [43]. Genetic correlations between SNHL and 767 other traits were computed using data taken from the MRC Integrative Epidemiology Unit (IEU)’s GWAS database (https://gwas.mrcieu.ac.uk/). The significance limit for correlations was set at a PFDR < 0.05.
Subgroup Effect DifferencesWe estimated if there were significant differences in the effect sizes of the lead variants at each locus between the analytical subgroups (i.e., those diagnosed before the age of 55 years vs. those diagnosed at or after 55 years of age, and females vs. males) using the following formula, with the corresponding P-values calculated from the normal distribution:
Effect size differences with PFDR < 0.05 were deemed statistically significant.
We used five prediction tools for assessing the consequences of the missense mutations (Table 1). PolyPhen-2 [44, 45], Sorting Tolerant From Intolerant (SIFT) [46, 47], and Protein Variation Effect Analyzer (PROVEAN) [48] assess the consequences of the mutation using conservation-based prediction, evaluating the variants by comparing similar proteins and considering local sequence conservation. To utilize meta-prediction and machine learning, we used the Rare Exome Variant Ensemble Learner (REVEL) [49], which has been shown to improve the prediction accuracy compared to methods based on sequence conservation alone. OpenCRAVAT interface was utilized in this approach (https://www.opencravat.org/), and we also report the consensus among all the missense prediction tools included in that platform. We exploited AlphaMissense, which combines structural context and evolutionary conservation of the mutated position to predict the consequences of missense variants [50, 51].
Table 1 Prediction of the consequences of the missense variants with selected algorithms. The prediction and scoring are provided for all the predictors. Unfortunately, AlphaMissense prediction was not available for rs2242416. Consensus score obtained from OpenCRAVAT is reported, where the number refers to predictions reporting the mutation being benign or tolerated; the total number of predictors applied is shown as well
Comments (0)