Both the Blenkin Taylor Atlas and the London Atlas had yet to be validated within a wide Australian population. Hence, this study had two predominant aims: (1) to test the performance of the Blenkin Taylor and the London Atlas within a population of Queensland, Australia; and (2) to determine whether there is a difference in the performance between the Blenkin Taylor and the London Atlas. The accuracy of the Blenkin Taylor and London Atlas methods was tested on a sample of 200 radiographs (100 male and 100 female) of individuals aged 5–18 years, and the influence of chronological age and sex was determined on their accuracy.
Entire sample
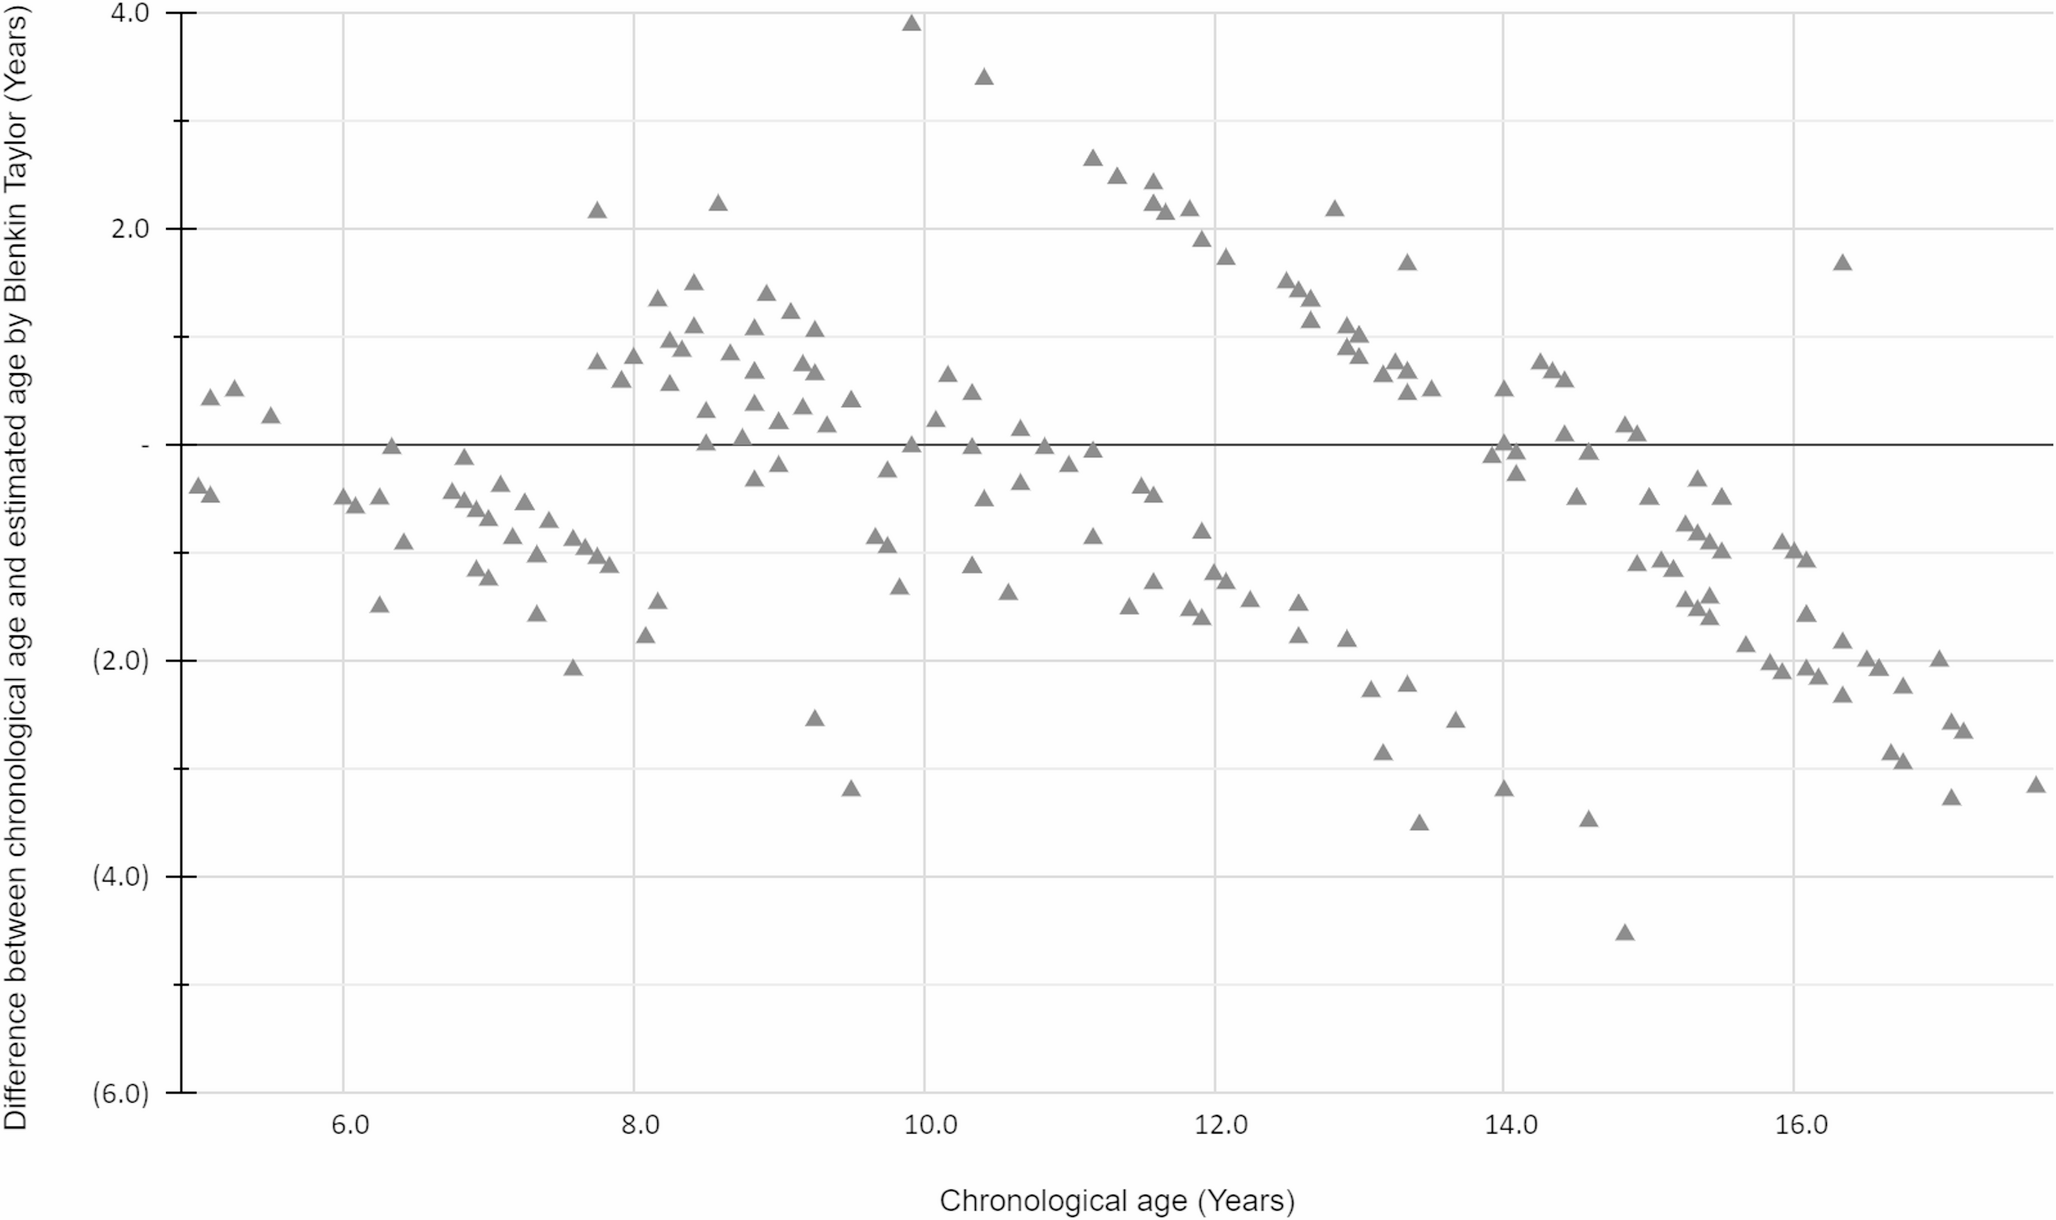
The mean chronological age of the entire sample was 11.54 (± 3.27) years. There was a statistically significant underestimation for both the Blenkin Taylor (−0.34 ± 1.44 years) and the London Atlas (−0.96 ± 1.64 years). Thus, the null hypothesis that there would be no difference between the age estimates by Blenkin Taylor or the London Atlas compared to the chronological age was rejected, and both the Blenkin Taylor and London Atlas produced significant underestimations of the sample In contrast, a study testing the accuracy of the Blenkin Taylor on an Indonesian population found an overestimation of 0.051 (CI: −0.393-0.496) years, but this was not statistically significant, potentially because of a low sample size (n = 34) [25] On the other hand, the literature appears divided on whether the London Atlas tends to underestimate or overestimate the study populations’ age. Similar to this Australian study, a Saudi study found there was a statistically significant underestimation [17], but was in contrast to another Australian study [26] and Turkish study [27], which found a statistically significant overestimation. Some studies failed to achieve statistical significance [21, 28] In the present study, the underestimation observed in both the Blenkin Taylor and the London Atlas may be the result of underestimation in cases of ambiguity. Although this may introduce a systematic bias, the minimum age concept places the legal onus on determining whether the individual has reached the age of legal majority with a degree of certainty; otherwise, that individual is afforded the privileges of being a minor [29]. Therefore, the conservative underestimation adopted in this study is appropriate to establish, with reasonable certainty, an individual’s minimum age rather than their maximum age.
Sex
Both the Blenkin Taylor and the London Atlas produced a statistically significant difference between males and females, and thus the null hypothesis was rejected. Both estimation methods produced a smaller difference between the estimated and chronological age for females compared to males. One New Zealand study found that when applying a percentage ‘best fit’ analysis to each age category, the Blenkin Taylor was more accurate for males than females, but their comparative difference between sexes was not tested for significance [30] On the flipside, the London Atlas produced a smaller difference between the estimated and chronological age for females compared to males, but none of these studies achieved statistical significance [17, 21]. In contrast, other studies demonstrated that the London Atlas was more likely to have a greater overestimation of females compared to males [27, 31,32,33,34] The inconsistency in the literature can be explained by the fact that these statistics were produced based only on sex and did not account for age. Although females generally develop teeth earlier than males [14], the start and rate of development may be different for each age group.
Age
In examining the influence of age on the estimation methods, Blenkin Taylor found there was statistical significance achieved only in the extremities of the age spectrum (Groups 6, 7, 8, and 15, 16, 17), which were all underestimated. Meanwhile, the London Atlas found there was a statistically significant overestimation in younger age groups (Groups 5, 8, 10) and underestimation in older age groups (Groups 12, 13, 14, 15, 16, 17) Neither of the two studies testing the accuracy of the Blenkin Taylor reported on any differences between ages without accounting for sex [25, 30] This study’s findings with the London Atlas were very similar to a study on a Saudi population, where there was also a non-statistically significant over-estimation in most younger age groups (6–9 years old) and statistically significant overestimation in all older age groups (10–15 years old) [17]. A Colombian study also found a statistically significant underestimation in even older age groups (21–23 years old) [31]. Alshihri et al. also found that the London Atlas was least accurate for samples aged 16 years and older [33]. The inaccuracy within the older age groups is likely because the London Atlas relies on the third molars, which have great variability in development and eruption between individuals [34,35,36]. On the other hand, an Indian study found statistically significant differences on dental age estimation between normal and disabled children (deaf & dumb) [37]. This finding suggests that Australian children with disabilities may also have deviated eruption patterns.
Age and sex
Statistical significance was found in the Blenkin Taylor method for males in Groups 7, 8, 15, 16, and 17, and females in Groups 6, 11, 15. For the London Atlas, statistical significance was found for males in Groups 11, 12, 13, 14, 15, 16, and 17, and females in Groups 6, 8, 10, 12, 14, 15, 16, and 17. The null hypothesis, stating that there would be no difference between the age estimates for males and females, was rejected. The only other study to have tested both the accuracy of the Blenkin Taylor and London Atlas on the same population was conducted in New Zealand [30]. It was found that the Blenkin Taylor produced statistically significant results for males aged 5.00–5.99, 6.00–6.99, 10.00–10.99, 13.00–13.99, and females aged 5.00–5.99, 6.00–6.99, 9.00–9.99, 10.00–10.99, and 14.00–14.99. Meanwhile, statistical significance was achieved with the London Atlas for males aged 10.00–10.99, 11.00–11.99, 13.00–13.99, 14.00–14.99, 15.00–15.99, and females aged 15.00–15.99 only. Further studies examining the combined influence of sex and age on the accuracy of the London Atlas produced no consistent pattern of inaccuracy [17, 21, 27, 33]. Although we tried to represent an equal number of men and women across the entire sample, a weakness in the analysis is a lack of homogeneity of men and women for each age group, which can affect the statistical outcome [38]. Nonetheless, for both the Blenkin Taylor and London Atlas, accuracy was more influenced by age group rather than sex, especially in the older age groups, where both estimation methods relied more on the highly variable development and eruption of the third molars.
Overall accuracy
Overall, the Blenkin Taylor produced statistically significant smaller bias and absolute mean difference between the estimated age and chronological age compared to the London Atlas. Thus, the null hypothesis was rejected as the Blenkin Taylor was more accurate than the London Atlas, which is consistent with the study applying both methodologies on a New Zealand population [30]. Although both age estimation systems tested provided a conservative underestimation of age, aligning with the minimum age concept, these are both radiological dental age estimation systems. Like any other forensic age estimation method, the overall accuracy of the age estimation process can be improved by using a combination of methods, such as clinical dental examination, hand x-ray, and clavicle assessment [29].


Comments (0)