
Remember me

Two experiments were performed, during which larvae were exposed to lower and higher concentrations of 5F-ADB.
To establish a colony of L. sericata for the first in vitro experiment, which also served to investigate drug influence on insect development, pupae of L. sericata were purchased from a commercial supplier (TerraristikShop.net, Herzogenaurach, Germany). Seventy pupae were placed in each of five rearing cages, each measuring 35 × 21 × 21 cm, and maintained at room temperatures. The species of the first emerging flies was confirmed morphologically using a taxonomic key for European blowflies [56]. Moistened sugar cubes and water in the form of soaked paper towels were provided ad libitum. Two large cups of raw, minced pork meat were introduced into each cage every evening to facilitate egg maturation and oviposition. Hatching larvae were either bred to the third instar to provide larval homogenate for toxicological method development (see Sect. 2.2) or bred to the end of the third generation for the first in vitro growth experiment.
For the second set of in vitro experiments, wild adults of L. sericata were collected outside the Institute of Forensic Medicine, Munich, using traps baited with raw sheep liver. Adult flies were maintained at ambient temperatures in rearing cages, with a maximum of two to three adults per cage. Raw, minced pork meat was introduced into each cage to encourage oviposition. After oviposition, adult flies were killed for morphological confirmation of the species [56], and only larvae hatching from egg clusters from L. sericata adults were used for further experiments.
In vitro experiments Meta-analysis of 5F-ADB concentrations in post-mortem peripheral blood to serve as a guideline to determine concentrations for In vitro experiment IMeta-analysis of post-mortem concentrations of 5F-ADB in peripheral blood was performed on an extensive literature review of intoxication cases with synthetic cannabinoids. Cases from seven published studies [24, 32, 33, 36, 57,58,59] were included, irrespective of post-mortem interval. Publications with available raw data (123 relevant cases) were used to calculate an overall median (0.21 µg/L) and mean concentration (0.41 µg/L) for 5F-ADB in post-mortem peripheral blood, which were used to define 5F-ADB concentrations for the first in vitro experiment using spiked meat (Fig. 3).
Fig. 3
Meta-analysis of seven published studies [24, 32, 33, 36, 57,58,59] of 5F-ADB concentrations in femoral blood of deceased persons, sampled at autopsy, indicating the median study effect (box)a, 95% confidence interval (CI95: error bars), mean (▲, triangles), and sample size (in brackets to right). 5F-ADB concentrations used for In vitro experiment I are indicated by red circles. (The raw data from Sharp et al. [58] were not available to be incorporated into the calculations)
aMedian of the individual study relative to that of the overall median.
Based on the results obtained from the meta-analysis, 0.12 µg/kg, 0.24 µg/kg, and 0.48 µg/kg were chosen as lower, intermediate, and upper concentrations, respectively, for the treatments of In vitro experiment I (Fig. 3). Food medium without the drug (0 µg/kg) served as control.
Literature review of 5F-ADB concentrations in post-mortem solid tissues to serve as a guideline to determine concentrations for In vitro experiment IIA second set of in vitro experiments were conducted to reflect 5F-ADB concentrations in solid human post-mortem tissues. For this, concentration data from three publications [24, 32, 60] could be employed as a guideline to determine 5F-ADB concentrations in the food medium (Table 1). Based on these data, 0 µg/kg, 0.48 µg/kg, 1.8 µg/kg, and 7.7 µg/kg were chosen as control, lower, intermediate, and upper concentration treatments for In vitro experiment II.
Table 1 Post-mortem concentrations of 5F-ADB in solid human tissues, grouped according to the lower, intermediate, and higher concentration rangesPreparation of fortified food mediumDuring growth experiments, limiting the amount of organic solvent in the food matrix is crucial to minimise any additional effect (i.e. other than the drug itself) on insect development. At the same time, drug solubility should be maintained for optimal homogeneity throughout the food source. To achieve this, a 1:4 mixture of ethanol (96%, Roti®Cell, Roth, Karlsruhe, Germany) and Dulbecco’s phosphate-buffered saline (DPBS, pH 7.0 ± 0.2, Roti®Cell, Roth, Karlsruhe, Germany) was prepared, based on the 5F-ADB-manufacturer’s specifications of its solubility. The 1:4 mixture of ethanol:DPBS served as solvent for a 120 µg/mL stock solution of (R)−5-fluoro-ADB (5F-ADB) (≥ 98%, Cayman Chemical, Ann Arbor, MI, USA), which was diluted in the same 1:4 mixture to afford 1.2 µg/mL and 0.12 µg/mL working solutions for fortification.
Raw, lean, minced pork meat, obtained from a commercial butcher, was used as food substrate for both in vitro experiments. Minced meat was divided into four batches of 240 g each for In vitro experiment I, and four batches of 120 g each for In vitro experiment II. Each batch was fortified with a total volume of 2 mL (experiment I) or 1 mL (experiment II), comprising the required volume of 5F-ADB solution and a drug-free 1:4 mixture of ethanol:DPBS to obtain the chosen experimental concentrations in meat. The control treatments (0 µg/kg) were spiked with 2 mL and 1 mL, respectively, of the drug-free 1:4 ethanol:DPBS mixture. The concentration treatments for In vitro experiment I, i.e. 0.12 µg/kg, 0.24 µg/kg, and 0.48 µg/kg were fortified with 240 µL, 480 µL, and 960 µL of the 0.12 µg/mL 5F-ADB working solution and 1760 µL, 1520 µL, and 1040 µL of the drug-free mixture. Similarly, the following volumes were each diluted to 1 mL with drug-free mixture and spiked to 120 g each of minced pork meat to obtain the concentration treatments 0.48 µg/kg, 1.8 µg/kg, and 7.7 µg/kg for In vitro experiment II: 480 µL of the 0.12 µg/mL working solution, and 180 µL and 865 µL of the 1.2 µg/mL working solutions.
Meat samples were homogenised in a standard kitchen food processor (SilverCrest Nutrition Mixture, Krefeld, Germany) for at least one minute to ensure thorough distribution of the substance within the matrix, taking care to prevent cross-contamination between batches. Each batch of meat was divided into three portions of 80 g each for In vitro experiment I and 40 g each for In vitro experiment II. Each portion was placed into a 100 mL plastic cup (replicates i, ii, and iii for each concentration treatment).
Exposing L. sericata larvae to different concentrations of 5F-ADBFor each of the two in vitro experiments, four plastic containers (18 × 11 × 12.5 cm) were prepared for each of the four different treatment concentrations, each container holding some straw for pupariation after the post-feeding stage and a datalogger (FreeTec V2, Munich, Germany) to record temperature and humidity.
Of third-generation insects from the established colony, 80 neonate larvae were carefully moved into each cup of meat with a moist brush. The three cups with the same drug concentration and larvae (replicates i, ii, and iii in Fig. 4) were placed into the bigger, plastic containers. Plastic containers were covered with nylon nets (Fig. 4) before simultaneous incubation of all four containers in a Memmert IPP 200 incubator (Schwabach, Germany) at 25(± 0.5)℃ and relative humidity (RH) of 70(± 10)%.
Fig. 4
Study design for the treatment and sampling of larvae from the different 5F-ADB treatment regimens from In vitro experiment I (Created with BioRender.com [61]). Only larvae from the 0.24 µg/kg treatment survived after 72 h of exposure
Three larvae per cup (i, ii, and iii) and concentration treatment were randomly sampled at specific intervals. Sampling was conducted at 4-hourly intervals for the first 24 h (t4, t8, t12, t16, t20, and t24), then at 6-hourly intervals for the subsequent 24 h (t30, t36, t42, and t48), and, where available, at 12-hourly intervals for the subsequent 48 h (t60, t72, t84, and t96) (Fig. 4).
By applying a moist brush, thirty neonate larvae were carefully moved into each cup, each containing 40 g of minced meat. Analogous to In vitro experiment I (Fig. 4), the three cups with the same drug concentration and larvae were placed into the bigger, plastic containers (e.g. replicates i, ii, and iii of the 0.48 µg/kg treatment were placed in the same, bigger container). The containers were each covered with a nylon net, and all treatment concentrations were incubated simultaneous in a Memmert IPP 200 incubator (Schwabach, Germany) at 25(± 0.5)℃ and RH of 70(± 10)%.
Starting at 24 h after incubation, three larvae per replicate cup (i, ii, and iii) and concentration treatment were randomly sampled in 12-hourly intervals until the end of the active feeding stage, followed by two sampling events during the post-feeding phase. Nine larvae from each concentration treatment were thus sampled at each of the following intervals after incubation at t0: t24, t36, t48, t60, t72, t93, and t105.
After selection, larvae were immediately killed by immersion in water at approximately 90 °C for one minute. This blanching method is the recommended standard for preserving fly larvae in an extended position, thereby facilitating subsequent length measurement [10, 14, 62] and toxicological analysis [14]. Larvae were washed and carefully dried on paper towels and the mass and length of larvae from In vitro experiment I measured directly after that. The mass of individual larvae was determined using a Mettler Toledo MX-5 microbalance (Greifensee, Switzerland) with a resolution of 1 µg. The body length of each larva was recorded to the nearest half millimetre (0.5 mm) under a Zeiss Stemi DV4 stereomicroscope (Carl Zeiss, Oberkochen, Germany) with a standard ruler [8, 62, 63].
All larvae were placed separately according to sampling time and treatment concentration and stored at −20 °C until toxicological analysis.
Statistical analysisThe effects of time (age) and dose on larval length and mass were tested with Analysis of Variance (ANOVA), using Statistica version 14.0.0.15 (2020, TIBICO Software Inc., Palo Alto, CA, USA). Initially, a three-way ANOVA was conducted, with time and dose as fixed effects, and beaker as a random effect. The beaker factor and its interactions were not significant (Supplementary Tables S4 and S5) and were thus not considered in subsequent analyses. A two-way crossed ANOVA was then used, with time and dose as fixed effects. Interaction plots for mass and length were generated to assess the effects of different drug concentrations on larval development over time.
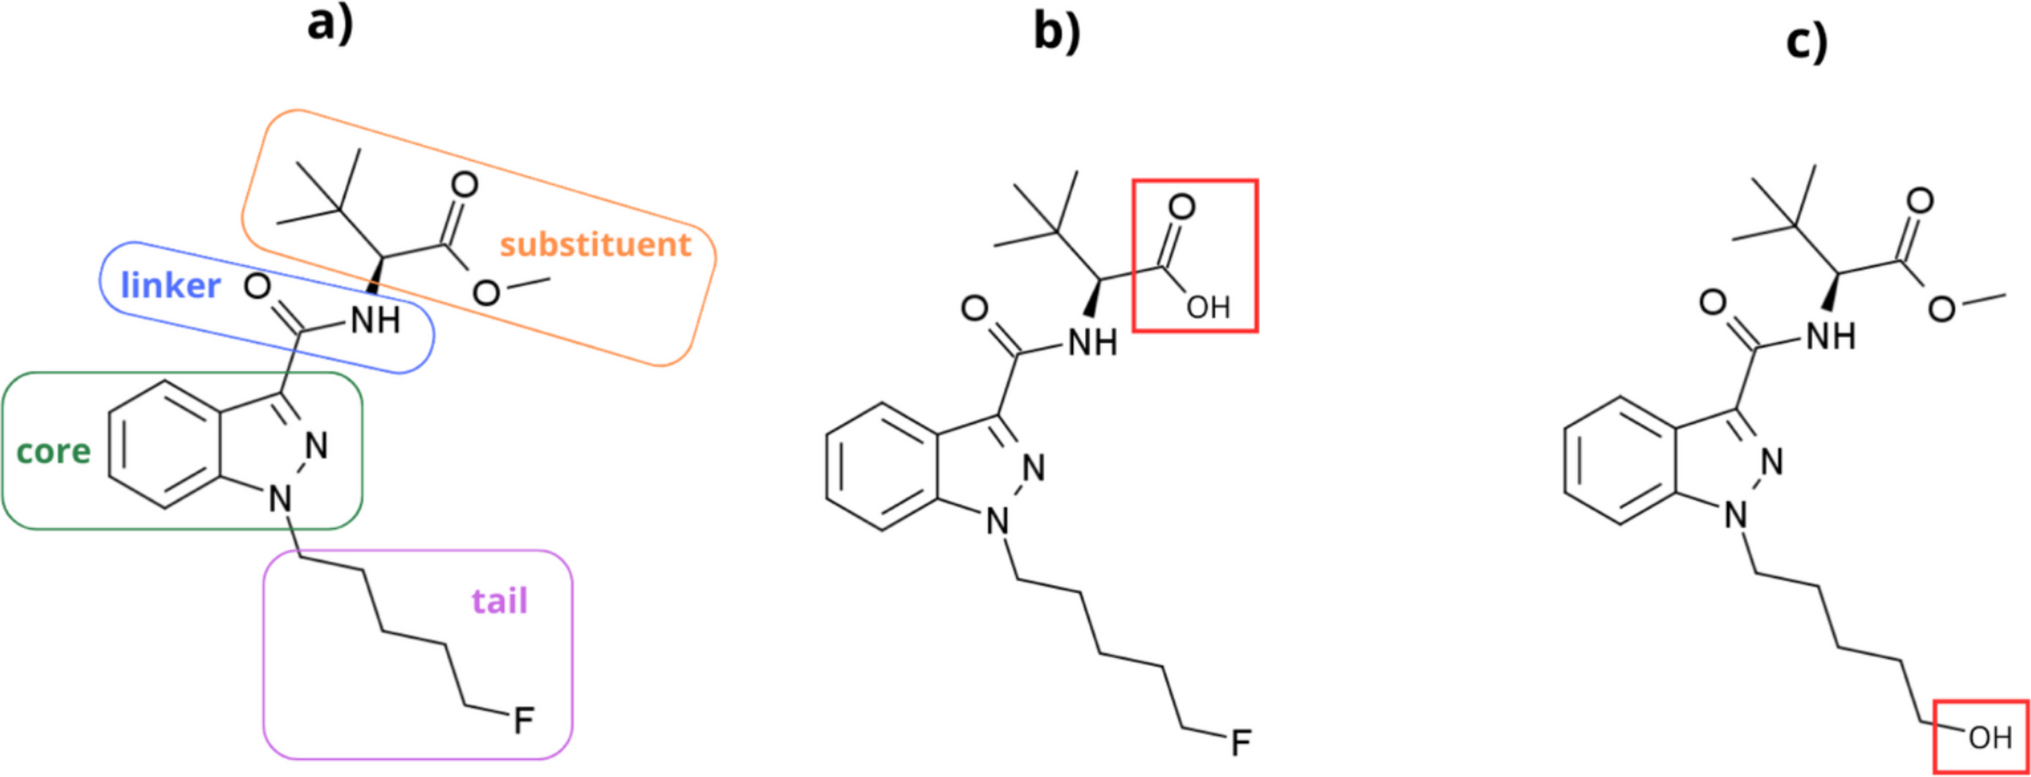
Toxicological analysisLarval sample preparationSeveral extraction procedures (including liquid–liquid extraction, protein precipitation, and solid-phase extraction) with varying parameters (e.g. pH and solvent composition) were evaluated for their effect on the recovery of SCRAs and their metabolites from larvae, as well as matrix interferences during liquid chromatography-mass spectrometric analysis. The following analytes with purities ≥ 98%, purchased from Cayman Chemical (Ann Arbor, MI, USA), were included in the analytical method: (R)−5F-ADB (N-[[1-(5-fluoropentyl)−1H-indazol-3-yl]carbonyl]−3-methyl-D-valine methyl ester), the 5F-ADB hydrolysis product (5F-ADB metabolite 7), the 5F-ADB hydrolytic/oxidative defluorination metabolite (5F-ADB metabolite 2), ADB-BUTINACA (N-[(1S)−1-(aminocarbonyl)−2,2-dimethylpropyl]−1-butyl-1H-indazole-3-carboxamide), the ADB-BUTINACA N-(4-hydroxybutyl) metabolite ((S)-N-(1-amino-3,3-dimethyl-1-oxobutan-2-yl)−1-(4-hydroxybutyl)−1H-indazole-3-carboxamide), the ADB-BUTINACA 3,3-dimethylbutanoic acid metabolite (MDMB-BUTINACA butanoic acid metabolite, N-[(1-butyl-1H-indazol-3-yl)carbonyl]−3-methyl-L-valine), MDMB-4en-PINACA (3-methyl-N-[[1-(4-penten-1-yl)−1H-indazol-3-yl]carbonyl]-L-valine methyl ester), and the MDMB-4en-PINACA butanoic acid metabolite ((S)−3,3-dimethyl-2-(1-(pent-4-en-1-yl)−1H-indazole-3-carboxamido) butanoic acid) (Fig. 1).
Considering extraction efficiencies and matrix effects, the most promising method was then applied to larvae that were exposed to 5F-ADB during both in vitro experiments to extract 5F-ADB, its ester hydrolysis product, hydrolytic/oxidative defluorination metabolite, and other human metabolites, followed by detection and quantification by LC–MS/MS. Sample extraction was performed as follows: Larvae exposed to different concentrations of 5F-ADB for varying times were pooled to obtain the required mass of approximately 200 mg per sample for extraction. Larvae from each of the concentration treatments 0.12 µg/kg, 0.24 µg/kg, and 0.48 µg/kg from In vitro experiment I were pooled as follows: 4–42 h, 48–60 h, and 72 h. Only larvae from the 0.24 µg/kg treatment survived after 72 h of exposure, which were also subjected to toxicological analysis. For In vitro experiment II, larvae from each of the concentration treatments 0.48 µg/kg, 1.8 µg/kg, and 7.7 µg/kg were pooled as follows: 24–36 h, 48 h, 60 h, 72 h, 93 h (post-feeding), and 105 h (post-feeding). All larvae from the 0 µg/kg treatments served as negative controls during toxicological analysis.
Each pooled sample of approximately 200 mg was weighed in a 2 mL disposable, reinforced Precellys® vial (Bertin Technologies, Montigny-le-Brettonneux, France), to which 200 µL isotonic sodium chloride (NaCl, ≥ 99%, Roth, Karlsruhe, Germany) solution (0.9% m/v) in purified water (Milli-Q Millipore filter system, Bedford, MA, USA) and five stainless steel beads (diameter: 2.8 mm) were added. Larvae were subsequently homogenised in a Precellys® 24 tissue homogeniser at 4000 RPM for 90 s.
For extraction, an internal standard (IS) mix of deuterated SCRAs, containing 5F-MDMB-PICA-d5, AB-FUBINACA-d4, AB-PINACA-d9, the AB-PINACA N-pentanoic acid metabolite-d4, ADBICA-d9, ADB-PINACA-d9, the JWH-073 N-(4-hydroxybutyl) metabolite-d5, JWH-015-d7, the JWH-018 N-(5-hydroxypentyl) metabolite-d5, the JWH-073 N-butanoic acid metabolite-d5, the JWH-122 N-(5-hydroxypentyl) metabolite-d5, JWH-200-d5, the JWH-250 N-(4-hydroxypentyl) metabolite-d5, MAM-2201-d5, and RCS-4-d9 was prepared using 10 µg/mL stock solutions of each analogue in acetonitrile (≥ 99.9%, HPLC Plus, Sigma-Aldrich, Steinheim, Germany), resulting in a final concentration of 250 µg/L each. All deuterated analytes were purchased from Cayman Chemical (Ann Arbor, MI, USA) with purities ≥ 98%. The most suitable deuterated internal standard substance was chosen for each of the analytes to compensate for matrix effects, as summarised in Table S1 of the Supporting information.
After the addition of 2 μL deuterated IS mix to the larval homogenate, 500 μL of acetonitrile with 2% ammonium hydroxide (NH4OH, ACS reagent, Sigma Aldrich, Steinheim, Germany) was added and the pH adjusted to 12 with 40 µL of a 10 N aqueous solution of sodium hydroxide (NaOH, ≥ 98%, Sigma Aldrich, Steinheim, Germany). Samples were thoroughly mixed for one minute and centrifuged at 6000 RPM for five minutes, followed by a pass-through SPE-protocol for purification. For this, the supernatant was transferred directly onto Oasis® PRiME HLB 3 cc cartridges (Waters GmbH, Eschborn, Germany), which do not require prior conditioning. The sample was slowly eluted under positive pressure, using the Waters Positive Pressure-96 Processor (Waters GmbH, Eschborn, Germany). Following an additional elution step with 250 µL of 2% NH4OH in acetonitrile to improve extraction efficiency, the eluate was evaporated to dryness at 37 °C under a stream of nitrogen.
Extracts were reconstituted shortly before analysis. For reconstitution, 100 µL of a 4:1 mixture of Mobile phase A (1% acetonitrile, 0.1% formic acid, and 2 mM ammonium formate in purified water) and Mobile phase B (1% formic acid and 2 mM ammonium formate in acetonitrile) for HPLC analysis was used. All extracts were passed through 0.45 µm VEREXTM regenerated cellulose (RC) filters (Phenomenex®, Aschaffenburg, Germany) to remove undissolved particles before liquid chromatography-mass spectrometric analysis.
Liquid chromatography tandem mass spectrometry (LC–MS/MS)LC–MS/MS analysis was performed on a Dionex Ultimate 3000 UHPLC system (Thermo Fisher, Dreieich, Germany), coupled to a QTrap 6500 (Sciex, Darmstadt, Germany) and equipped with an electrospray ionisation (ESI) source, operated in positive ionisation mode. Details of the MRM method are summarized in Table S1 of the Supporting information. All data acquisition and processing were performed using Analyst (ver. 1.6, Sciex, Darmstadt, Germany).
Details of the instrumental conditions are published elsewhere [46]. In brief, the oven and autosampler were set to 40 °C and 10 °C, respectively. Chromatographic separation was achieved on a Kinetex® C18 column (2.6 μm, 100 Å, 100 × 2.1 mm, Phenomenex, Aschaffenburg, Germany), applying a multistep gradient elution over a total run time of 8.25 min. The gradient for Mobile phase B (see Sect. 2.2.1 for composition of Mobile phases A and B) was programmed as follows: Starting at 25% and a flow rate of 0.45 mL/min, shifting to 70% at 6.5 min, and then to 90% at 6.8 min with flow rates increasing up to 0.60 mL/min. The gradient was rapidly returned to the initial conditions at 7.85 min, followed by re-equilibration. The injection volume was 10 µL for identifying all target analytes included in the method.
For the identification of further 5F-ADB metabolites, a second run was performed with 15 µL injection volume and the same LC-gradient, using previously published phase I and II metabolites for comparison [64, 65]. For a retention time comparison of the phase I metabolites, a 1 mg/mL stock solution of 5F-ADB was incubated into a pooled human liver microsome assay (pHLMs) according to a previously published protocol [66]. For comparison with true human metabolites, two serum samples from human cases that tested positive for 5F-ADB phase I and II metabolites, as well as an enzymatically hydrolyzed urine sample from a real human case with phase I metabolites were analysed, using previously published protocols [66,67,68]. In addition to retention time matching with products from the pHLMs and positive human samples, an unscheduled measurement was performed to detect other possible metabolites with the same transitions that may have formed in larvae. A summary of these metabolites, including several monohydroxylated derivatives and glucuronic acid conjugates, together with their mass transitions and optimised mass spectrometric parameters is provided in Table S2 of the Supporting information.
For quantification in larval samples, calibration curves for each analyte were generated using at least six calibration points in the calibration range 0.25–10 µg/kg (R2 ≥ 0.99). Chromatograms of the analytes at the lowest calibrator concentration are shown in Fig. S1 of the Supporting information. Calibration curves were generated from extracts of drug-free larvae that had been spiked with the deuterated internal standard substances and the synthetic cannabinoid analytes at the corresponding concentrations. Area ratios of the target ions between the analyte and the corresponding deuterated IS (Table S1) were plotted against substance concentration and Mandel’s F test (significance 99%) was applied to identify the linear range for each substance. Matrix effects and extraction efficiencies for each analyte were determined according to the post-extraction spike method [69], applying area ratios of target ions between the analyte and the corresponding deuterated IS at analyte concentrations in the middle of the calibration range (5 µg/kg). Matrix effects were calculated from area ratios of signals between analyte and the corresponding deuterated IS substance obtained from reconstitution solvent (Mobile phases A:B, 4:1) and extracted blank larval matrix that had been fortified to an analyte concentration of 5 µg/kg. Extraction efficiencies were estimated by comparing the signals in blank larval matrix fortified to 5 µg/kg with all compounds after extraction to the signal in samples fortified to the same concentration before extraction. The limits of detection (LOD) and limits of quantification (LOQ) for all SCRA analytes were determined from a dilution series in the concentration range between 0.025 µg/kg and 0.25 µg/kg in larval homogenate, followed by a calculation in validation software (Valistat ver. 2.0, Arvecon GmbH, Walldorf, Germany), considering a signal-to-noise ratio of at least 3.
Comments (0)