Materials
Rutin (RU), hydroxypropyl-β-cyclodextrin (Cy), cholesterol (CH), phosphatidylcholine (PC), xanthan gum (XG) and carbopol (CRP) were from Sigma-Aldrich (St Louis, MO, USA). All other materials and solvents were from Merck Serono S.p.A. (Rome, Italy).
Preparation and Characterization of Cy/RU and RUCyL
The complexes of Cy and RU (Cy/RU) were prepared in water at the 4:1 molar ratio. Notably, after weighing Cy and RU using an analytical balance (ACCULAB, Sartorius AG, Göttingen, Germany), they were dispersed by swirling and sonication in an ultrasonic bath (Branson 2510, Cinisello Balsamo, Italy) for 15 min and left in an orbital shaker for 24 h [21].
RUCyL were prepared by the “thin film hydration” method followed by ultrasonication (Branson 2510, Cinisello Balsamo, Italy) [22]. Precisely, a mixture of PC and CH (4:1 mol/mol) in methylene chloride: methanol (1:1 v/v) was poured into a round-bottom flask and evaporated under reduced pressure conditions (p ≅ 60 bar) in a Buchi Rotavapor R-200 (Cornaredo, Italy). The formed thin lipid film was then hydrated by swirling (VELP scientifica s.r.l., Usmate Velate, Italy) with the aqueous complex Cy/RU and ultrasonicated for 30 min in a Branson 2510 bath (Cinisello Balsamo, Milan, Italy).
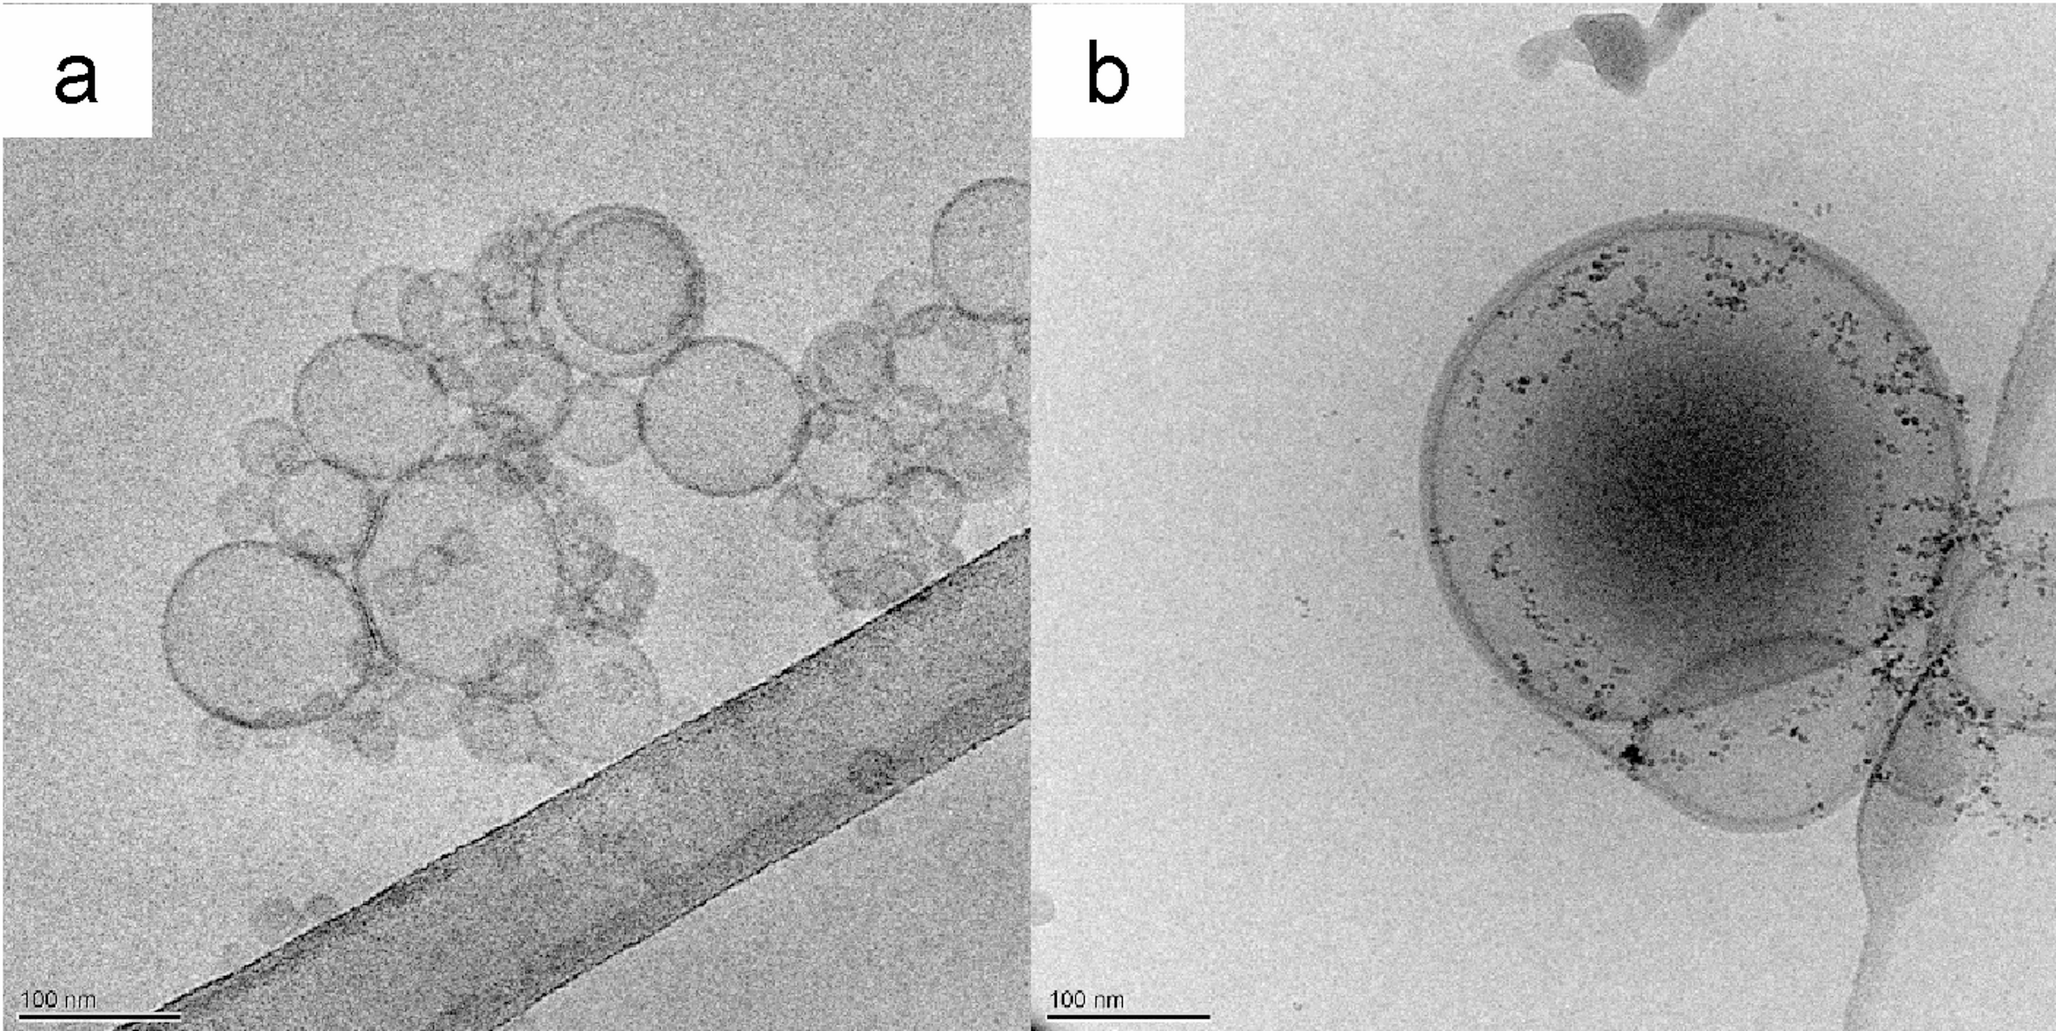
The morphology of RUCyL was investigated using a Cryogenic Transmission Electron Microscope (Cryo-TEM) (Zeiss EM 922 Omega TEM, Gatan Inc., Pleasanton, CA, USA) equipped with a cryo holder CT3500 [23]. Specimens were visualized using doses of approximately 1000–2000 e/nm2 at 200 kV at a sample temperature of below − 175 °C, and the obtained images were recorded by a CCD camera and processed with GMS 1.4 software (Gatan Inc., Pleasanton, CA, USA).
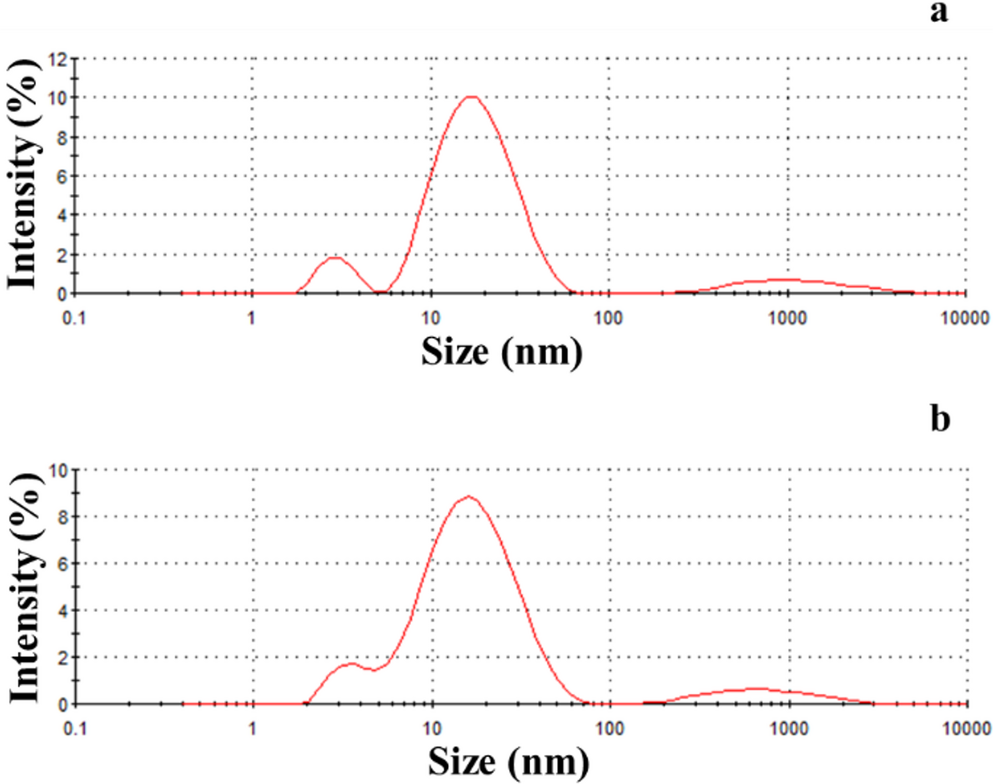
RUCyL size measurements, performed on aqueous diluted fractions (1:10 by volume), were conducted with a Zetasizer Nano S90 (Malvern Instr., Malvern, UK) equipped with a 5 mW helium-neon laser with a wavelength output of 633 nm. Measurements, conducted at 25 °C, 90° angle and run time around 180 s [24], allowed the obtaining of a dimensional distribution graph, as well as the Z-Average and PdI values of the vesicular formulations [25].
Determination of Rutin Content
A UV-VIS-NIR Spectrometer Lambda 19 spectrophotometer (Perkin Elmer, Beaconsfield, UK) equipped with quartz cuvettes with an optical path of 1 cm, and the Windows-based software application UV WinLab (Perkin Elmer, Beaconsfield, UK) was employed to determine the content of RU in the produced formulations. Specifically, the external standard method was selected as the quantitative analytical determination. Therefore, the mean values of at least 3 samples of each scalar dilution of RU in ethanol, ranging from 40 µg/ml to 2.5 µg/ml, were used to obtain the calibration curve. Each concentration was analyzed at wavelength λmax = 360 nm (R2 = 0.9999) [26].
The encapsulation efficiency (EE) in RUCyL, expressed as RU content, was determined one day after production on a 300 µl sample of the formulation obtained after ultracentrifugation conducted at 8000 rpm for 20 min on a Spectrafuge™ 24D Digital Microcentrifuge (Woodbridge, NJ, USA) by means of a Microcon centrifugal filter unit YM-10 membrane (NMWCO 10 kDa, Sigma-Aldrich, St. Louis, MO, USA). 100 µl of the retentate ultracentrifuged sample was diluted with methanol (1:10, v/v) and subjected to magnetic stirring for 30 min before UV quantification of RU. The encapsulation parameter was calculated using Eq. (1).
$$EE=RU/T_\times100$$
(1)
where RU is the amount of rutin determined by UV, and TRU is the total RU amount weighed to prepare the formulation. The RU estimation was carried out as described above using the calibration curve as a reference.
In Vitro Diffusion Experiments
RU diffusion was evaluated using Franz cells associated with a nylon membrane. Briefly, membranes were hydrated in distilled water at room temperature for 1 h before mounting on Franz diffusion cells (LGA, Berkeley, CA) with a 1 cm diameter orifice (0.78 cm2 exposition area). The receiving phase, consisting of PBS 73mM (5 ml) at pH 7.4, was magnetically stirred at 300 rpm and maintained at 32 ± 1 °C during the experiments [27]. 1 ml of each formulation was poured in contact with the membrane surface in the donor chamber and 300 µl of the receiving phase were withdrawn at predetermined time points for RU content UV analysis. The removed receiving phase volume was replaced with an equivalent amount of PBS. The estimated mean values ± standard deviations of diffused RU, measured in four different experiments, were expressed as µg/cm2 and plotted as a function of time.
The kinetic parameters were determined by linear regression analysis of the in vitro diffusion experimental data according to the best mathematical models expressing the kinetic release profile, namely zero-order (cumulative amount of drug released over time), first order (logarithmic cumulative amount of drug remained over time), Higuchi (cumulative amount of drug released over the square root of time) and Korsmeyer-Peppas equations (logarithmic fractional drug released over logarithm of time). The regression coefficient (R2) and the release exponent (n) were determined, allowing the prediction of the mathematical model.
Antioxidant Activity
To rapidly assess the antioxidant capacity, the DPPH radical liberation assay [28] was used. This assay estimates the hydrogen-donating capacity of an antioxidant to convert the stable free radical DPPH into 1,1-diphenyl-2-picrylhydrazyl, which is accompanied by a deep purple to light yellow colorimetric reaction, which can be assessed by measuring the percentage reduction in absorbance of the solution at 517 nm after the reaction of the radical with the test products. The percentage scavenging capacity of the radical was obtained by applying Eq. (2), as follows:
$$DPPH\;radical\;scavenging\;capacity\;\left(\%\right)=\left[1-\left(A1/A0\right)\right]\times100$$
(2)
where A0 is the absorbance of the control (without the antioxidant molecule, AM), and A1 is the absorbance in the presence of AM. AM (both in solution and in cyclodextrins) at different concentrations (0.750 mL) was added to a methanol solution of DPPH (1.5 mL). The absorbance at 517 nm was obtained with a UV-Vis spectrophotometer (ONDA UV-31 SCAN Spectrophotometer) as previously described [29]. The IC50 values obtained (µg/mL) were derived from calibration straight lines and are the mean ± standard deviation of at least three independent experiments.
The quantitative FRAP assay measures the plasma ferric ion-reducing capacity, as it is based on the reduction of ferric ions (Fe3+) to ferrous ions (Fe2+) under acidic conditions in the presence of 2,4,6-tripyridyl-s-triazine (TPTZ) [30]. Indeed, the presence of an AM allows the reduction of the Fe3+–TPTZ complex to the ferrous form, resulting in an intense blue coloration measured at 593 nm (absorption maximum wavelength). Trolox was employed to perform the calibration curves; therefore, the FRAP antioxidant activity is given as µmol Trolox equivalent/g of compounds.
Gel Preparation and Characterization
To obtain thickened formulations, XG and CRP were added to the selected RU-containing Cy and CyL formulations. In particular, XG (0.5%, w/w) was added to the formulation, then manually mixed and planetary stirred overnight to achieve complete dispersion [31]. On the other hand, CRP (0.5%, w/w) viscosified formulations were prepared by magnetic stirring at 50 °C, planetary stirring overnight, followed by triethanolamine addition.
The viscosity of the thickened formulations was measured by means of a Brookfield, Helipath Stand rotational viscometer (Brookfield Engineering Laboratories, Massachusetts, USA). It is known that the determination of viscosity of a formulation depends on the properties of the system under examination, the type of viscometer, the impeller used, the rotation speed, the temperature, the volume analyzed and the dimensions of the container. For the measure, 50 ml of gel were placed in a beaker and tested at a temperature of 25 °C. A cylindrical impeller was immersed inside, and the viscosity was measured at different speeds between 1 and 100 rpm [31].
The spreading capacity of gels was evaluated 24 h after gel preparation at 32 ± 1 °C [32]. Notably, 100 mg of the thickened formulation were poured on a 3 cm diameter Petri dish and pressed by means of a 10 g mass onto a glass dish. The time taken for the gel to completely fill the capsule was then evaluated. The spreadability test was repeated three times, and the mean values ± standard deviations were calculated using Eq. (3).
where S stands for gel spreadability, m for the weight (g) onto the dish top, l for the dish diameter (cm), and t for the time (s) taken by the gel to completely fill the dish diameter [32].
The in vitro leakage of gels was determined on rectangular agar slides obtained from dissolving agar (1.5% w/w) in citrate buffer (pH 5.5) followed by stirring at 95 °C until complete solubilization, cooling and cutting agar slides homogeneous in dimensions.
30 mg of gel were placed on one side of the agar slide inserted into a Petri dish positioned vertically at 90° and maintained at 32 ± 1 °C. After placing the gel on top of the slide, the time spent by the gel to flow down the slide was measured. Gel loss, expressed as the travel time of the gel on the plate, was repeated three times and the mean values ± standard deviations were determined.
Patch Test
To assess the effect of the produced formulations on intact human skin, an in vivo irritation test was conducted in agreement with the protocols for skin compatibility testing of potentially cutaneous irritant cosmetic ingredients on human volunteers [33,34,35]. Specifically, those volunteers suffering from dermatitis (a), skin allergic reactions (b) or undergoing treatment with all the types of anti-inflammatory drugs (a) were excluded from the study. 20 healthy volunteers of both sexes were subjected to an occlusive patch test after giving their written consent to the experiment. A Finn Chamber® (Bracco, Milano, Italy) made of aluminum and loaded with 10 mg of the formulation, was applied onto the forearm or back skin; then the skin was protected with self-adhesive tape. The formulations were left in contact with the skin for 48 h, then the patch was removed, and the skin was cleansed 15 min and 24 h after removal. Therefore, the irritative reactions were expressed as a percentage of the total number of reactions occurring in volunteers after assessing and classifying the erythematous and/or edematous reactions as mild, clearly visible, or moderate/severe erythema.
Statistical Analysis
GraphPad Prism 10 (Version 10.3.1 (464), GraphPad Software Inc., La Jolla, CA, USA) was used to perform the statistical analysis. For each of the variables tested, an analysis of variance (2-way ANOVA), followed by Tukey’s post hoc test, was assessed. The data are expressed as the mean ± SD of triplicate determinations obtained in three independent experiments, and a p value < 0.05 was considered statistically significant.


Comments (0)