Chemicals and Enzymes
Veech Ketone ester (> 95% purity), (R)−1,3-BD, and sodium (R)-BHB (Sigma-Aldrich, St. Louis, MO) standards were generously provided by Todd King at the National Institutes of Health (Bethesda, MD). Other supplies (also obtained domestically within the USA) include (±)-aldol (henceforth referred to aldol; Chem Services Inc., West Chester, PA), nicotinamide adenine dinucleotide sodium salt (AmBeed, Arlington, IL), ethyl lactate (Chem-Impex Int’l Inc., Wood Dale, IL), methanol (Honeywell Inc., Charlotte, NC), formic acid (88% v/v; Fisher Scientific, Fair Lawn, NJ), potassium phosphate di-basic (LabChem, Zelienople, PA), and potassium phosphate mono-basic (Sigma, St. Louis, MO). Hepatic subcellular fractions were purchased from SEKISUI XenoTech, LLC (Kansas City, KS), specifically human liver S9 fraction (HLS9; 20 mg/mL, pool of 200, mixed-gender, H2610.S9 / Lot # 1,210,252), human liver cytosolic fraction (HLC; 10 mg/mL, pool of 200, mixed-gender H2610.C / Lot # 1,810,002), male rat liver S9 fraction (male RLS9; 20 mg/mL, pool of 200, R1000.S9 / Lot # 2,010,058), and female rat liver S9 fraction (female RLS9; 20 mg/mL, pool of 200, R1500.S9 / Lot # 1,110,039).
Human and Rat Liver S9 Incubation of KE
To optimize the incubation time and the protein concentration for the enzyme kinetic study, 50 µM KE was incubated in triplicates at 37°C in 50 mM potassium phosphate buffer pH 7.4 with human liver S9 fractions (0.01 – 0.05 mg protein/mL) from 0–45 min. The reactions were stopped by adding 3 × the volume of ice-cold methanol (containing 300 µM ethyl lactate as internal standard), vortexed and centrifuged at 27,000 RCF for 10 min at 0°C, then stored at –20°C until analysis. The linearity of KE depletion was studied from the optimization experiments for incubation time and protein concentration. Incubation time was set to 45 min, and the protein concentration was kept at 0.02 mg/mL for both human and rat S9 fractions. Metabolic experiments were performed by incubating KE (5 – 15,000 μM) with human or rat liver S9 fractions (0.02 mg/mL) for 45 min.
Human and Rat Liver Fraction Incubation of (R)−1,3-BD
The suspension medium used by the manufacturer for the human liver S9 fractions contained glycerol, which is also an alcohol that might compete and interfere with (R)−1,3-BD for metabolism. To circumvent this issue, human liver cytosolic fraction was used to study the metabolim of (R)−1,3-BD, as it did not contain glycerol or any other alcohol in its suspension medium. Previous literature reports indicate the presence of alcohol and aldehyde dehydrogenase in human liver cytosolic fraction (30, 31). For optimizing the incubation time and the protein concentration for the enzyme kinetic study, 1,000 μM (R)−1,3-BD was incubated with various protein concentrations of the human liver cytosolic fractions (0.5 – 1.0 mg/mL) from 0–60 min at 37°C in 50 mM potassium phosphate buffer pH 7.4, with NAD+ (5 mM) as a co-factor for ADH and ALDH. The concentrations of protein and were adapted from a similar study where the metabolism of 1,4-butanediol was studied (32). The reaction was stopped by adding 3 × the volume of ice-cold methanol. The samples were vortexed and centrifuged at 27,000 RCF for 10 min at 0°C. The samples were stored at –20°C before further analysis. Subsequent incubations had a protein concentration of 1.0 mg/mL, and the incubation time was 60 min. (R)−1,3-BD was incubated at different concentrations ranging from 500–50,000 μM. The incubations were done in triplicate.
For metabolism in rat liver, hepatic S9 fractions were used as the commercial product did not contain glycerol (or any other alcohol). Similar incubation conditions were used, as noted above, and at the same protein concentration. (R)−1,3-BD concentrations ranging from 500–50,000 μM were incubated. (R)−1,3-BD was incubated with the reaction mixture without NAD+ a negative control.
Aldol Metabolism in Human Liver Fractions
The metabolism of aldol in the human liver was evaluated using human liver cytosolic fraction in the absence of glycerol. For optimizing the incubation time and the protein concentration for the enzyme kinetic study, 1,000 µM aldol was incubated with various protein concentrations of the human liver cytosolic fraction (0.01 – 0.05 mg/mL), at 37°C, in 50 mM potassium phosphate buffer pH 7.4 (done in triplicate) using NAD+ (5 mM) as a co-factor. The reaction was stopped by adding 3 × the volume of ice-cold methanol. The samples were vortexed and centrifuged at 27,000 RCF for 10 min at 0°C. The samples were stored at –20°C before analysis. The linearity of aldol depletion was studied from the optimization experiments for incubation time and protein concentration. For subsequent studies, the incubation time was set to 40 min, and the protein concentration was kept at 0.05 mg/mL. Metabolic experiments were performed by incubating various concentrations of aldol ranging from 500 – 50,000 μM. aldol was incubated with the reaction mixture without NAD+ a negative control.
Protein Binding of KE, (R)−1,3-BD, and Aldol
To correctly assess the hepatic clearance of the molecules, it was necessary to calculate the fraction bound to the hepatic fractions (S9 and cytosolic). The fraction bound was determined using Rapid Equilibrium Dialysis (RED) devices (Pierce Biotechnology (Waltham, MA)), according to the manufacturer’s instructions. Briefly, a 1,000 μM solution of (R)−1,3-BD was prepared in the dialysis buffer (phosphate-buffered saline (PBS) containing 100 mM sodium phosphate) and placed in the donor chamber of the insert. A 1.0 mg/mL protein concentration was prepared using human liver cytosolic fraction or male rat liver S9 fraction using the same dialysis buffer and placed in the receiver chamber. After 4 h, the reaction was stopped by adding 2 × the volume of ice-cold methanol, the samples were centrifuged, and the supernatant was analyzed using LC–MS. The protein binding of KE could not be determined experimentally as incubating it with liver fractions would initiate its metabolism; thus, the protein binding was estimated based on the mathematical method described by Halifax and Houston, 2006 (33, 34). The protein binding for aldol was estimated using the same mathematical method.
Determination of Metabolic Kinetic Parameters
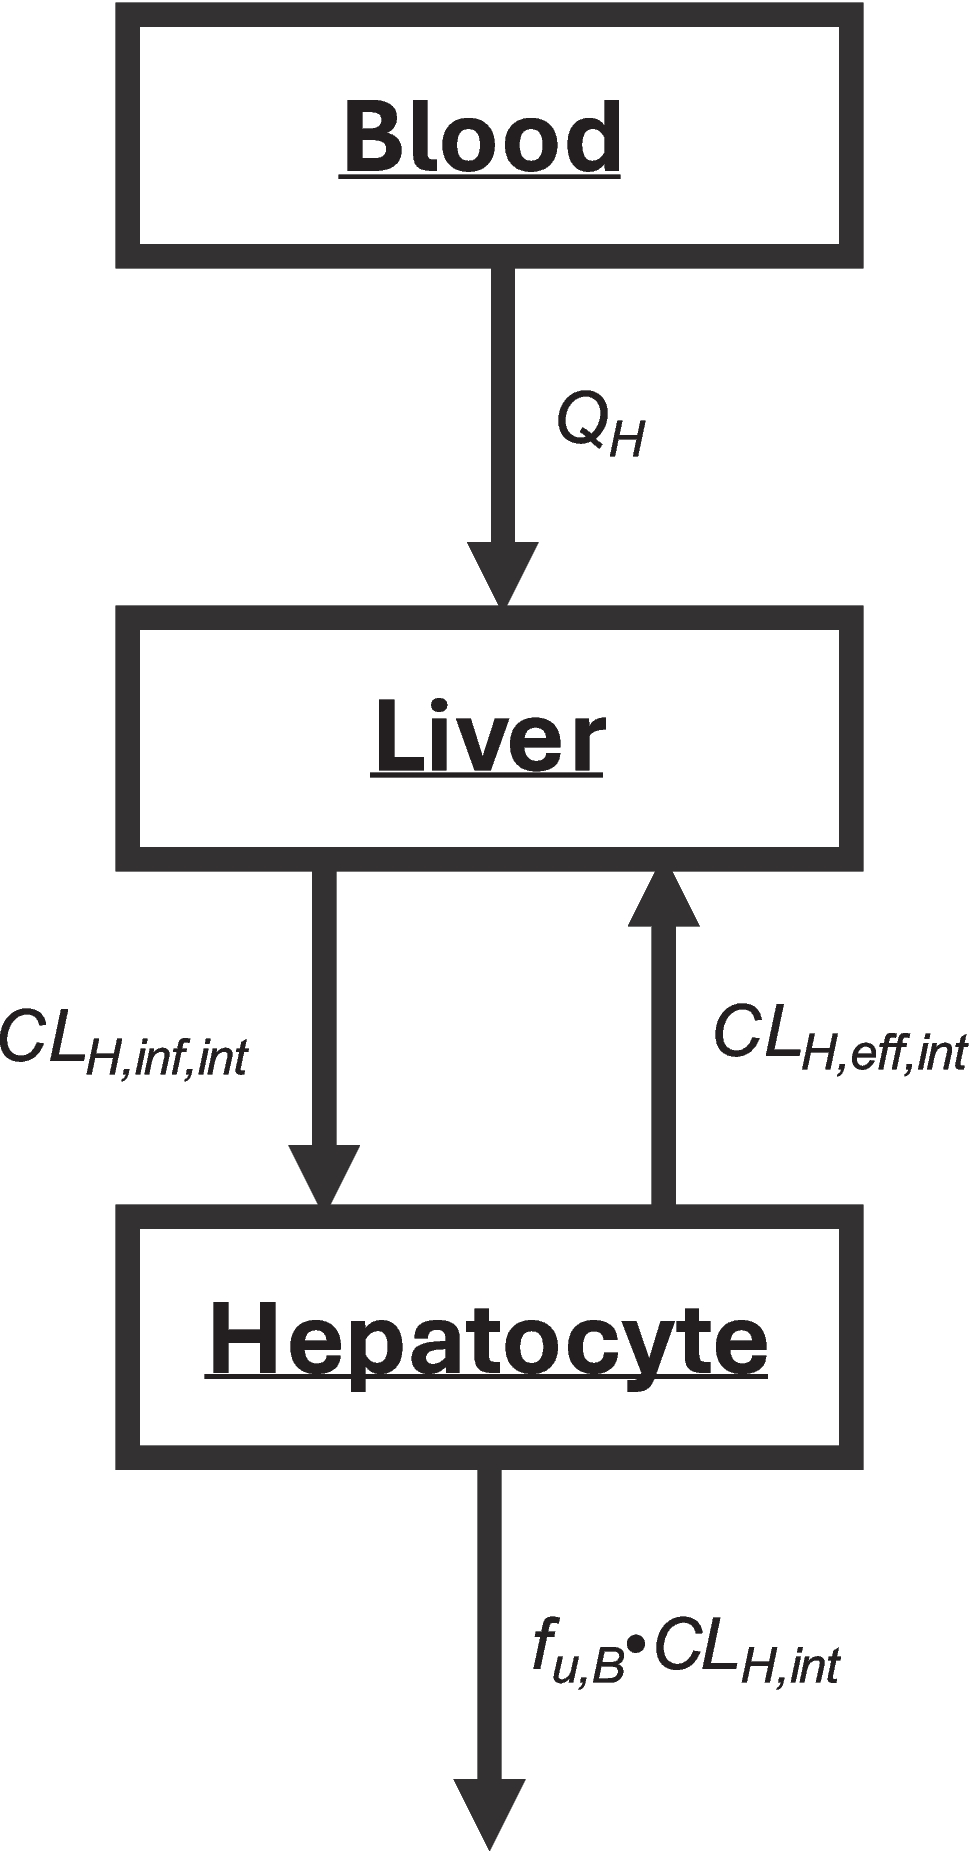
The rate of depletion for each molecule was calculated by measuring the concentration remaining in the reaction mixture at each time point (compared to the concentration at time point zero minutes). The Michaelis–Menten model was fit to the data of the rate of metabolism at each concentration, and the Michaelis–Menten equation was used to determine metabolic kinetic parameters such as Vmax and Km using Prism (Ver. 9.5.1) (GraphPad Software, Inc., San Diego, CA). The intrinsic clearance (mL/min/mg protein) was calculated using Eq. (1). The hepatic blood flow in rats and humans was taken to be 89.7 mL/min/kg body weight (BW) and 21.5 ml/min/kg BW, respectively (35, 36). The amount of S9 protein in humans was taken to be 121 mg/g of the liver, and in rats was taken to be 136 mg/g of the liver (37). In the case of human cytosolic fraction, the protein concentration was taken as 45 mg/g of liver (38). The weight (g) of liver per kg BW was taken to be 25.7 g/kg BW for humans, and 50 g/kg BW for rats (36). The intrinsic hepatic clearance (mL/min/kg BW) for rats and humans were calculated using Eqs. (2–4). The hepatic clearance accounting for the blood flow rate through the liver was calculated using the equation for the well-stirred model (Eq. (5)), and the parallel-tube model (Eq. (6)). The hepatic extraction ratio was calculated using Eq. (7). The binding of KE and aldol to the plasma were assumed to be negligible while that to liver fractions proteins were calculated to be very low (< 0.5%). The binding of (R)−1,3-BD to liver fraction proteins was calculated here, and the binding to plasma protein was calculated previously in our lab and was found to be 22% protein bound in human plasma and 2.0% in rat plasma (28). Here, fu, s9, f, fu,p, were the unbound fraction in human and rat liver S9 fractions, human liver cytosolic fraction, and human plasma, respectively.
$$CL_\left(mL/min/mg\;protein\;\right)=\frac}$$
(1)
$$_\left(\frac}BW\right)=CLu_\left(\frac}S9\;protein\right)\ast121\left(\fracgliver\right)\ast25.7\left(\frac\right)\ast f_.$$
(2)
$$_\left(\frac}BW\right)=CLu_\left(\frac}cyt\;protein\right)\ast45\left(mg\;cyt\fracgliver\right)\ast25.7\left(\frac\right)\ast f_.$$
(3)
$$_\left(\frac}BW\right)=CLu_\left(\frac}S9\;protein\right)\ast136\left(mg\;S9\fracgliver\right)\ast50\left(\frac\right)\ast f_.$$
(4)
$$_\left(\frac}bw\right)=Q_H\ast\frac\ast Cl_}\ast Cl_\right)}$$
(5)
$$_\left(\frac}bw\right)=Q_H\ast\left(1-e^}\right)}\right)$$
(6)
$$ER=\frac_*_}_+\left(_*_\right)}$$
(7)
HPLC and LC-MS Analysis
The methods for quantifying KE and (R)−1,3-BD have been developed and validated previously by our lab (28). The concentration ranges tested during incubations were based on the linear assay range for each molecule. Briefly, the samples were removed from –20°C, thawed, and then centrifuged at 15,000 rpm for 10 min at 4°C. For the analysis of KE and (R)−1,3-BD, the LC–MS method used a Zorbax RX C-18 column (150 mm × 4.6 mm, 3 µm, Agilent Technologies (Torrance, CA, USA). The mobile phase consisted of methanol (solvent A) and 0.1% formic acid (solvent B). The gradient elution was used as follows: [time (min), B%] = [0, 80] to [1.10, 60] to [3.50, 80] to [6.00, 80]. The column was kept at ambient temperature, and the flow rate and the injection volume were set at 1 mL/min and 10 μL, respectively. A flow-switching valve (Gilson, Middleton, WI) was used to divert the effluent to waste for the first 1.3 min and then to the detector (1.3 – 4.5 min). Detection consisted of an Acquity QDa mass spectrometer (Waters, Milford, MA) working in positive ion mode as described below. Ethyl lactate was used as the internal standard (m/z of 141 in positive ion mode).
The sodium adducts [M + Na] were used for detection with m/z values of 199.00 (for KE) and 113.00 (for (R)−1,3-BD). Linear calibration curves were obtained from 1 – 500 μM for KE, and 500–20,000 μM for (R)−1,3-BD. The retention times for KE, and (R)−1,3-BD were 4.05 and 1.75 min, respectively. Data acquisition and processing were performed using Empower 3 software (Waters, Milford, MA). In the case of aldol, it did not show ionization in the positive or negative ion mode using electrospray mass spectrometry. Instead, an HPLC–UV method was used for its analysis. It showed strong absorbance at 230 nm, and hence this wavelength was used for its detection. Briefly, a Zorbax RX C-18 column (150 mm × 4.6 mm, 3 µm, Agilent Technologies (Torrance, California, USA) was used at ambient temperature. The isocratic mobile phase consisted of methanol (20%) and aqueous 0.1% formic acid (80%) at 1 ml/min, with an injection volume of 20 uL. The retention time for aldol was 4.40 min, and linear calibration curves (r2 > 0.99) were obtained between 500–20,000 μM. The representative chromatograms for each molecule are shown in the supplementary material.


Comments (0)