
Remember me

Systemic drug levels, CD4 counts, and HIV-1 RNA values were obtained from six phase 1 clinical trials aiming to evaluate the safety, pharmacokinetics and antiviral activity of ARVs administered as a monotherapy either orally (BIC, TAF, EVG, and FTC), or subcutaneously in a long release formulation (LEN) to adult persons with HIV who were either ARV-naive or treatment-experienced. Participants in each study were required to be between 18 and 65 years old and have a baseline CD4 count of at least 200 cells/µL and exhibit a viral load of at least 2,000 copies of viral RNA per mL (with some studies requiring up to 10,000 copies/mL). The main exclusion criteria included co-infection with hepatitis B virus or hepatitis C virus. The studies were conducted in accordance with established protocols and adhered to the principles of the Declaration of Helsinki. The protocols were approved by local institutional review boards or ethics committees at each participating institution. All patients provided written informed consent according to Good Clinical practice and local legislation.
Table 1 lists the main study design characteristics of each clinical trial, along with the dosing schedules, treatment duration, and sampling schemes for biomarkers of viral activity (CD4 + T cell counts and HIV-1 RNA).
Table 1 Main Design Characteristics of the Six Clinical Trials with Information about the Drug, Treatment Regimen and Schedule of Sampling TimesPatient PopulationIn total, 196 participants were included in the pooled analysis dataset, with 29 participants in the placebo arms. The patient population was mostly male (92.9%), with age ranging from 19 to 65 years (median 35 years). Race was reported as other/not specified for 36.7% of the population with black/African American representing 30.6% and white 28.6%. Other reported races were Asian, American Indian and Native Hawaiian. Supplementary table S1 summarizes the population patient characteristics of each clinical trial.
Analytical DeterminationA range of analytical techniques were employed to accurately quantify the PK plasma samples, CD4 + T-cell counts and HIV-RNA levels. Plasma PK samples were analyzed utilizing validated techniques. CD4 + T cell counts were measured using flow cytometry. Additionally, HIV-RNA quantification was performed using the Roche COBAS TaqMan v2.0 platform in all studies, which employs real-time polymerase chain reaction (PCR) technology for precise viral load assessment.
Data Analysis for Population PKPD ModelsThe population analysis was performed using NONMEM 7.5.1 (21) with Monte Carlo estimation methods including Stochastic Approximation Expectation Maximization (SAEM) and Importance Sampling (IMP). Data was logarithmically transformed for the analysis. Residual errors were characterized with a proportional model for both HIV-RNA and CD4 + T cells. Inter-individual variability (IIV) was associated arithmetically to the typical parameter using mu referencing. Given the complexity of the model Bayesian priors were implemented for some parameters, assuming a normal distribution for fixed effects and inverse-Wishart distribution for random effects (19).
Data below the lower limit of quantification (3.4% of HIV-RNA measurements and 0.5% of CD4 + T cell counts) were excluded from the analysis (M1 method) (22).
PopPKPD Model SelectionModel selection was conducted based on the following criteria: (i) visual assessment of goodness-of-fit plots, (ii) evaluation of parameter precision expressed as the coefficient of variation [CV (%)], and (iii) the log-likelihood ratio test. Nested models with a single parameter eliminated with a reduction of 3.84 or 6.61 points in the objective function value were deemed significantly improved at the 5% and 1% significance levels, respectively (23).
Model EvaluationPerformance of the selected models was evaluated using simulation-based diagnostics, in particular, prediction-corrected visual predictive checks (pc-VPCs) (24) and numerical predictive checks (NPCs) (25) for changes from baseline in HIV-RNA levels stratified by ART. The precision of the parameters was further investigated calculating the 95% confidence intervals estimated from the analysis of 500 bootstrap datasets.
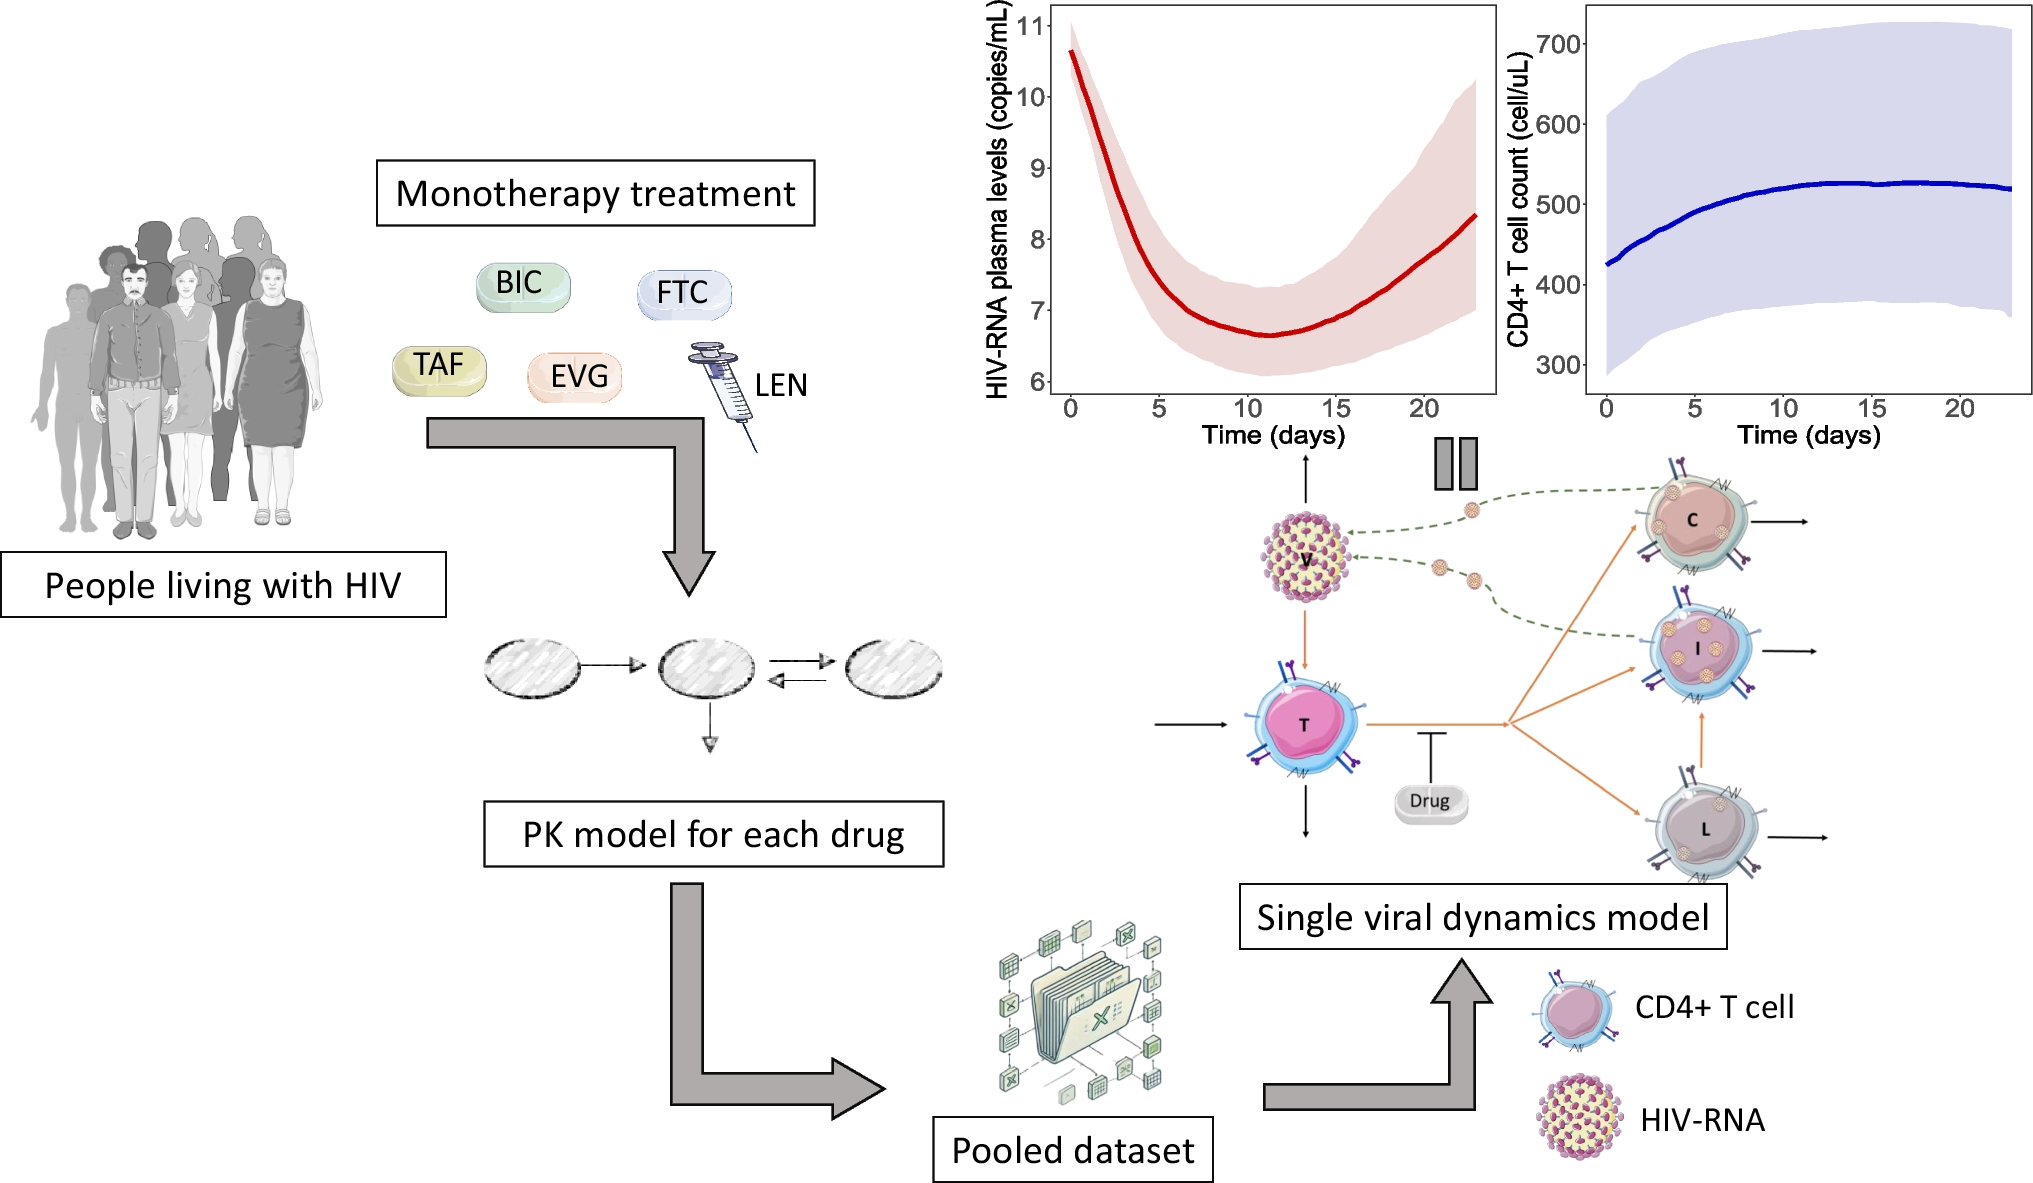
Viral Dynamics ModelThe CD4 + T cell counts and HIV-RNA data from each clinical trial were pooled together to establish a single Viral/CD4 count model. Model development followed a sequential approach where the pharmacokinetics of each drug was first characterized and subsequently the empirical Bayes estimates of the PK model were then used to generate the plasma concentration vs time profiles of each individual as drivers of the antiviral effect during the development of the viral dynamics model. Supplementary material 1 provides a detailed description of the PK models used in the current evaluation.
The “basic” viral dynamic model tracks levels of uninfected CD4 + T cell (T), virus (V), and infected cells (I), and it is represented mathematically by the following set of ordinary differential Eqs. (1,2,3)10:
$$\frac=\lambda-\delta_T\cdot T-\left(1-\varepsilon\right)\cdot\beta\cdot V\cdot T$$
(1)
$$\frac=\left(1-\varepsilon\right)\cdot\beta\cdot V\cdot T-\delta_I\cdot I$$
(2)
$$\frac=N_i\cdot\delta_I\cdot I-\delta_V\cdot V$$
(3)
where \(\lambda\) is a zero-order production rate constant of T cells, and δT, δI and δV are the first-order rate constants accounting for the elimination of T, I and V, respectively. The parameter Ni represents the number of virions that an infected cell can produce, and β represents the viral infectiveness. The term (1-ϵ) accounts for the effect of the drugs. Expressions for initial conditions and derived parameters are shown in supplementary material 2-A.
During model building, the base structural model suggested major misspecification. Therefore, several additions to the base structural model were tested and model building proceeded according to the model selection criteria defined above. During model development, two additional types of infected cells were added, based on other similar literature models (e.g., from A. Perelson) (26, 27): chronic cells (C) and latent cells (L)11,24. In the model, the “infected” cell population (I) corresponds to actively infected CD4⁺ T cells that are producing virus and have a short lifespan undergoing rapid lytic infection (28, 29). The “chronically infected” compartment (C) represents CD4⁺ T cells that harbor integrated provirus that continue to produce virus at a lower rate and over extended periods (30, 31). The “latently infected” compartment (L) reflects resting memory CD4⁺ T cells containing transcriptionally silent integrated provirus, which can remain undetected until reactivation (32). The expanded model is described in Eqs. 4 through 8 and depicted in Fig. 1.
Fig. 1
Graphical representation of the proposed model with the five populations: Virus (V), CD4 + T cells (T), Ordinary Infected cells (I), Chronically infected cells (C) and Latently infected cells (L) with the respective parameters of the system
This model assumes that once infected, CD4 cells can progress into either a chronically infected state (8, 33) or a latently infected state, where in the viral genome integrates into the host cell, halting viral production (34, 35). The parameters α and μ represent the fraction of T cells that enter the latent and chronic states, respectively, whereas the remainder (1-(α + μ)) corresponds to the fraction of actively infected cells. C and L cells are eliminated with first-order rate constants δC and δL, respectively. The model assumes that latent cells have small turnover rate because they do not express viral proteins, making them less susceptible to immune clearance. Furthermore, they do not produce virus, minimizing cellular damage (36). In addition, L cells can be reactivated following a first-order process governed by the parameter a. Lastly, the parameters Ni and Nic account for the number of virions released during cell lysis from the active and chronic cells, respectively. The model assumes that chronically and actively infected cells have different virion production rates because of differences in viral gene expression, as well as transcription and translation rates for viral proteins. The total release rate depends on both the number of virions released per lysing cell (Ni and Nic) and the rate of cell lysis (δC, δL).
$$\frac=\lambda -\left(1-\varepsilon \right)\cdot \beta \cdot V\cdot T-_\cdot T$$
(4)
$$\frac=\left(1-\varepsilon \right)\cdot \left(1-\left(\alpha +\mu \right)\right)\cdot\beta \cdot V\cdot T-_\cdot I+a\cdot L$$
(5)
$$\frac=\left(1-\varepsilon \right)\cdot \alpha \cdot \beta \cdot V\cdot T-_\cdot L-a\cdot L$$
(6)
$$\frac=\left(1-\varepsilon \right)\cdot \mu \cdot \beta \cdot V\cdot T-_\cdot C$$
(7)
$$\frac=_\cdot _\cdot I+_\cdot _\cdot C-_\cdot V$$
(8)
The model assumes that at the start of treatment, the V, T, I, C and L compartments are in steady state. Total CD4 + T cells are given by the sum of T, I, C, and L cells. The exploratory analysis indicated a lack effect on the placebo arm, group in which treatment was not administered and viral load was unchanged. Based on the article from Callaway D. (2002) (8), we assumed μ to be 100 times α and tested this assumption using the placebo data. Initial conditions of the model and derived parameters are shown in supplementary material 2-B.
Regardless of the mechanism of action, either reverse transcriptase, integrase or capsid inhibition, drug effects were incorporated in the model by reducing infectivity by a factor of \(\left(1-\varepsilon \right)\), where the efficacy parameter \(\varepsilon\) is described by the sigmoidal EMAX (Eq. 9):
$$\varepsilon=\frac\cdot C^\gamma}\gamma}$$
(9)
where EMAX is the maximum fractional decrease in \(\beta\) that the drug can elicit, EC50 is the concentration of drug in plasma (C) eliciting half-maximal efficacy, and \(\gamma\) describes the shape of the inhibition curve.
Viral Dynamics SimulationsThe final model was then implemented in mrgsolve (37) and used to conduct deterministic simulations and explore the anti-viral efficacy of different dosing strategies. Treatments were run until viral load decreased below 50 copies/mL and the treatment duration to achieve an undetectable/untransmissible state was quantified. After this limit was reached, treatment was discontinued, and simulations continued until the viral load increased to 1500 copies/mL (38), at which point, individuals would be capable of viral transmission. The latter simulation exercise was performed with the objective of evaluating the time to reach this threshold. For the case of LEN, since it was given as a single dose, simulations were prolonged until the rebound of viremia was observed.
SoftwareData visualization and model evaluation were performed using R version 4.3.0 through RStudio interface. Population PK-PD analyses were conducted using NONMEM® version 7.5.1 (ICON PLC, Ireland). Simulations were carried out translating the final NONMEM® control file into a mrgsolve model using the mrgsolve package. Model management was carried out using Pirana 21.11.1 (39).
Comments (0)