
Remember me


To investigate whether AT protects skin against photoaging, we established two AT models. One model utilized inguinal skin with SAT as the AT group, whereas the adjacent skin without SAT served as the control (Fig. 1a). Before UVB irradiation, HE and Masson staining revealed no significant differences in epidermal or dermal thickness between the two groups (Figs. S1, S2). After 8 weeks of UVB exposure, the AT group presented improved skin elasticity (Fig. 1b). The manifestations of photoaging observed in the skin of nude mice can serve as a model for the pathological changes observed in human ageing skin, with a substantially growing epidermis, thinning dermis, and more aged cells [31]. Histological analyses, including HE, Masson, Sirius Red, and SA-β-gal staining, revealed that the AT group had a thinner epidermis, a thicker dermis, increased collagen content, and fewer senescent cells. These findings indicate that AT strongly contributes to a more youthful appearance of the skin from photoaging (Figs. 1c, S3).
Fig. 1
AT has a protective effect on the skin under ultraviolet B (UVB) irradiation. a Gross image of the AT group with subcutaneous adipose tissue (SAT) in the inguinal area and the adjacent control group without SAT before UVB exposure. b Quantification of skin elasticity in the control group and AT group. c HE, Masson, Sirius Red, and immunofluorescence staining to determine epidermal thickness, dermis thickness, collagen deposition, and SA-β-gal expression in the control group and AT group. Scale bars = 50 μm. d Schematic diagram of fat grafting and UVB irradiation on the back. e Gross images of skin texture from the control group and fat graft group after UVB irradiation. f, g Quantification of the melanin content and skin elasticity in the control group and fat graft group. h HE, Masson, Sirius Red, and immunofluorescence staining to determine epidermal thickness, dermis thickness, collagen deposition, and SA-β-gal expression in the control group and fat graft group. Scale bars = 100 μm. i The mRNA expression of Col1A1, MMP9, and CDKN1A in the two groups. j, k The protein expression of Col1, MMP9, and p21 in the two groups. *p < 0.05, ***p < 0.001
In the alternative model, a fat graft placed beneath the dorsal skin constituted the fat graft group, with PBS injection serving as the control. Two weeks post-transplantation, Oil Red O staining confirmed the survival of the grafted AT (Fig. S4). The groups showed no significant difference in skin elasticity or melanin content (Fig. S5). After UVB exposure (Fig. 1d), the transplanted fat in the fat graft group remained viable (Fig. S6), and the skin appeared smoother with fewer wrinkles than that in the control group (Fig. 1e). The CK-MPA10 results revealed reduced melanin levels and improved elasticity in the fat graft group (Fig. 1f, g). Histological staining revealed that the fat graft group exhibited epidermal thinning, dermal thickening, increased collagen production, and reduced cellular senescence, which was consistent with the results from the inguinal skin model (Figs. 1h, S7). Molecular analysis, including qRT‒PCR and WB, revealed the upregulation of Col1A1 and the downregulation of MMP9 and CDKN1A in the fat graft group (Fig. 1i‒k). These findings further support the conclusion that the presence of AT substantially mitigates UVB-induced photoaging, leading to the rejuvenation of ageing skin.
The protective effect of AT-EVs on the skin under UVB irradiation is similar to that of ADSC-EVsTo investigate whether AT-EVs are the mechanism by which AT exerts its protective effects, we used nude mice, as shown in Fig. 2a. Previous research has demonstrated the skin-protective properties of ADSC-EVs under UVB exposure [20], establishing these EVs as positive controls. Cells from AT were cultured and differentiated into adipocytes and osteoblasts (Fig. S8) to confirm their identity. Both ADSC-EVs and AT-EVs were characterized via electron microscopy (Fig. 2b) and a flow NanoAnalyzer, which revealed average sizes of 61.3 ± 17.8 nm and 63.9 ± 18.0 nm, respectively (Fig. S9). Furthermore, both ADSC-EVs and AT-EVs expressed the surface markers CD9, CD63, and CD81 (Fig. S10) and were taken up by NIH3T3 cells labelled with PKH26 (Fig. S11).
Fig. 2
AT-derived extracellular vesicles (AT-EVs) can alleviate skin photoaging caused by UVB. a Schematic diagram of EV injection and UVB irradiation. b Morphology of EVs shown by transmission electron microscopy. Scale bar = 200 nm. c Gross images of skin texture in the four groups after UVB irradiation. d, e Quantification of skin elasticity and melanin content in the four groups. f HE, Masson, Sirius Red, immunofluorescent and situ dihydroethidium red fluorescence staining to determine epidermal thickness, dermis thickness, collagen deposition, SA-β-gal expression and ROS levels in the four groups. Scale bars = 50 μm. g-k Statistical analysis of epidermal thickness, dermis thickness, collagen deposition, SA-β-gal expression, and dihydroethidium fluorescence. l-n The mRNA expression of Col1A1, MMP9, and CDKN1A in the four groups. *p < 0.05, **p < 0.01, ***p < 0.001, n.s., no significant difference between groups
After eight weeks of UVB exposure, the AT-EV-treated skin exhibited a reduced number of skin wrinkles (Fig. 2c). Additionally, skin elasticity and melanin content improved in the AT-EV group (Fig. 2d, e). Compared with those in the UVB group, histological analysis via HE, Masson, Sirius Red, SA-β-gal, and in situ dihydroethidium red fluorescence staining (Fig. 2f) revealed that the AT-EV group had a thinner epidermis, a thicker dermis, increased collagen levels, fewer senescent cells, and lower ROS levels (Fig. 2g-k). Furthermore, AT-EVs modulated skin gene expression, increasing Col1A1 expression and decreasing MMP9 and CDKN1A expression (Fig. 2l-n). The experimental results revealed no significant differences between the AT-EV group and the ADSC-EV group.
In summary, AT-EVs, which function similar to AT, mitigated the histological manifestations of photoaging, promoted collagen production and deposition, reduced ROS and MMP9 levels, and alleviated signs of ageing, providing skin protection under UVB exposure similar to that of ADSC-EVs. These results suggest that AT exerts its protective effects through AT-EVs.
AT-EVs also have a protective effect on NIH3T3 cells during UVB exposure and can more rapidly promote cell proliferationFor determination of the impact of AT-EVs on UVB-exposed fibroblasts, NIH3T3 and human fibroblasts were treated and analysed (Fig. 3a). AT-EVs increased Col1A1 levels while decreasing MMP9 and CDKN1A levels in NIH3T3 cells, as confirmed by both qRT‒PCR and WB (Fig. 3b‒d). Human fibroblasts treated with AT-EVs exhibited reduced senescence, as indicated by fewer SA-β-gal-positive cells (Fig. 3c, d), and decreased ROS accumulation, as measured via DCFH2-DA (Fig. 3g, h). The experimental results revealed no significant difference between the ADSC-EV group and the AT-EV group. Overall, AT-EVs protect fibroblasts by reducing ROS levels, promoting collagen synthesis, decreasing MMP expression, and alleviating cellular senescence. Furthermore, AT-EVs increased NIH3T3 cell proliferation more rapidly than ADSC-EVs did at 24 h post-UVB irradiation, suggesting that AT-EVs may be absorbed by cells more quickly than ADSC-EVs are, thereby exerting their effects more efficiently (Fig. 3i). These findings prompted further investigation into the mechanism by which AT-EVs can protect the skin from photoaging and be internalized more rapidly.
Fig. 3
AT-EVs can protect fibroblasts during UVB irradiation. a Schematic diagram of the process of cell intervention and UVB irradiation. b The mRNA expression of Col1A1, MMP9, and CDKN1A in the four groups. c, d The protein expression of Col1, MMP9, and p21 in the four groups. e SA-β-gal staining revealed differences in FB senescence among the four groups. Scale bars = 100 μm. f Quantification of SA-β-gal-positive cells in the four groups. g The fluorescence intensity reflects the level of intracellular ROS production after intervention and UVB irradiation. Scale bars = 50 μm. h Quantification of the level of ROS production in the four groups. i CCK-8 analysis of NIH3T3 cell proliferation in the four groups after 72 h (n = 5). *p < 0.05, **p < 0.01, ***p < 0.001, n.s., no significant difference between groups
AT-EVs exhibit a rich variety of subpopulations, with many AT-EVs expressing CD151 and APN on their surfaceThe uptake of EVs is associated with the tetraspanins on their surface [32]. The differential expression of surface proteins on AT-EVs and ADSC-EVs may account for the more rapid absorption of AT-EVs by cells than that of ADSC-EVs. To investigate this finding, we compared the surface protein expression of AT-EVs and ADSC-EVs obtained from 10 patients (Fig. 4a), whose BMIs ranged from 19.473 to 30.071. We employed PBA analysis, which sorts EVs into subpopulations on the basis of their surface proteins [27]. Additionally, we compared the quantities of ADSC-EVs and AT-EVs. We used 10 ml of AT to extract ADSCs and another 10 ml of AT from the same patient to extract AT-EVs. ADSC-EVs were extracted directly without expanding the ADSC mixture. The quantities of EVs were determined via a Flow NanoAnalyzer. The number of AT-EVs was significantly greater than that of ADSC-EVs in the same volume of AT (Fig. 4b). Specifically, the count of AT-EVs in 10 ml of AT was approximately 6.1 × 10¹¹, which was approximately 200 times greater than the number of ADSC-EVs (Fig. 4c).
Fig. 4
Surface protein sequences and EV subpopulations of AT-EVs and ADSC-EVs. a Schematic diagram of sample collection and detection. b Flow NanoAnalyzer was used to count the number of ADSC-EVs and AT-EVs in 10 ml of AT. c Quantification of AT-EVs and ADSC-EVs in 10 ml of AT. d Principal component analysis revealed significant differences in protein expression between ADSC-EVs and AT-EVs. e Heatmap showing the top 100 differentially expressed proteins. f The FlowSOM algorithm distinguished the subpopulations of AT-EVs and ADSC-EVs, and the t-SNE plot displayed fourteen subpopulations. g The distribution of AT-EVs and ADSC-EVs among subpopulations. h Heatmap displaying the proteomic biomarker characteristics of each subpopulation. i Proportion of each subpopulation of ADSC-EVs and AT-EVs. j The expression of AdipoQ and CD151 on the surface of ADSC-EVs and AT-EVs. **p < 0.01. (Created with BioRender.com)
Patient data are provided in Supplementary Material 3. Principal component analysis revealed distinct surface protein expression profiles between ADSC-EVs and AT-EVs (Fig. 4d), with high correlations among biological replicates within each group, as shown by the Pearson correlation coefficient (Fig. S12). After normalization via the trimmed mean of M values method, the protein expression levels were determined (Fig. S13). A heatmap highlighted the top 100 differentially expressed surface proteins, notably showing higher levels of CD151 and AdipoQ in AT-EVs (Fig. 4e). AdipoQ in AT-EVs may have anti-inflammatory and protective effects in response to UVB exposure. t-SNE plots illustrated the clustering of EVs, distinguishing 14 clusters via FlowSOM (Fig. 4f), which were colour-coded to represent their group origins and to illustrate differences among subpopulations (Fig. 4g). The biomarkers for each cluster are shown in Fig. 4h. Most clusters exhibited positive CD151 expression. ADSC-EVs were primarily represented by one subpopulation, with cluster 1 (97.2%) characterized by the expression of AIF1, TIMP2, and FN1 (Fig. 4h, i). AT-EVs displayed greater diversity and encompassed all 14 clusters. Clusters 13 and 3 had the highest proportions, at 28.4% and 15.4%, respectively. Both clusters were characterized by CD151 and ITGB1, with cluster 13 showing strong overexpression of CD151 and cluster 3 showing strong overexpression of ITGB1 (Fig. 4h, i). The analysis of surface protein expression indicated that AT-EVs had significantly higher levels of AdipoQ and CD151 than ADSC-EVs did, with 517 AT-EVs coexpressing both proteins, in contrast to only 1 ADSC-EV (Fig. 4j).
Compared with ADSC-EVs, AT-EVs presented greater surface protein diversity. We analysed surface protein expression on 13,332 EVs from both ADSC-EVs and AT-EVs. AdipoQ was expressed in 41 (0.30%) ADSC-EVs and 656 (4.92%) AT-EVs. CD151 was found in 264 (1.98%) ADSC-EVs and 11,122 (83.42%) AT-EVs. Compared with 517 (3.88%) AT-EVs, only 1 ADSC-EV showed coexpression (Fig. 4j). These findings underscore the increased subpopulation diversity, including 13 clusters beyond the primary ADSC-derived cluster, and the increased expression of key proteins such as CD151 and AdipoQ on AT-EVs, which may contribute to their increased efficacy of cellular uptake and protective effects under UVB exposure.
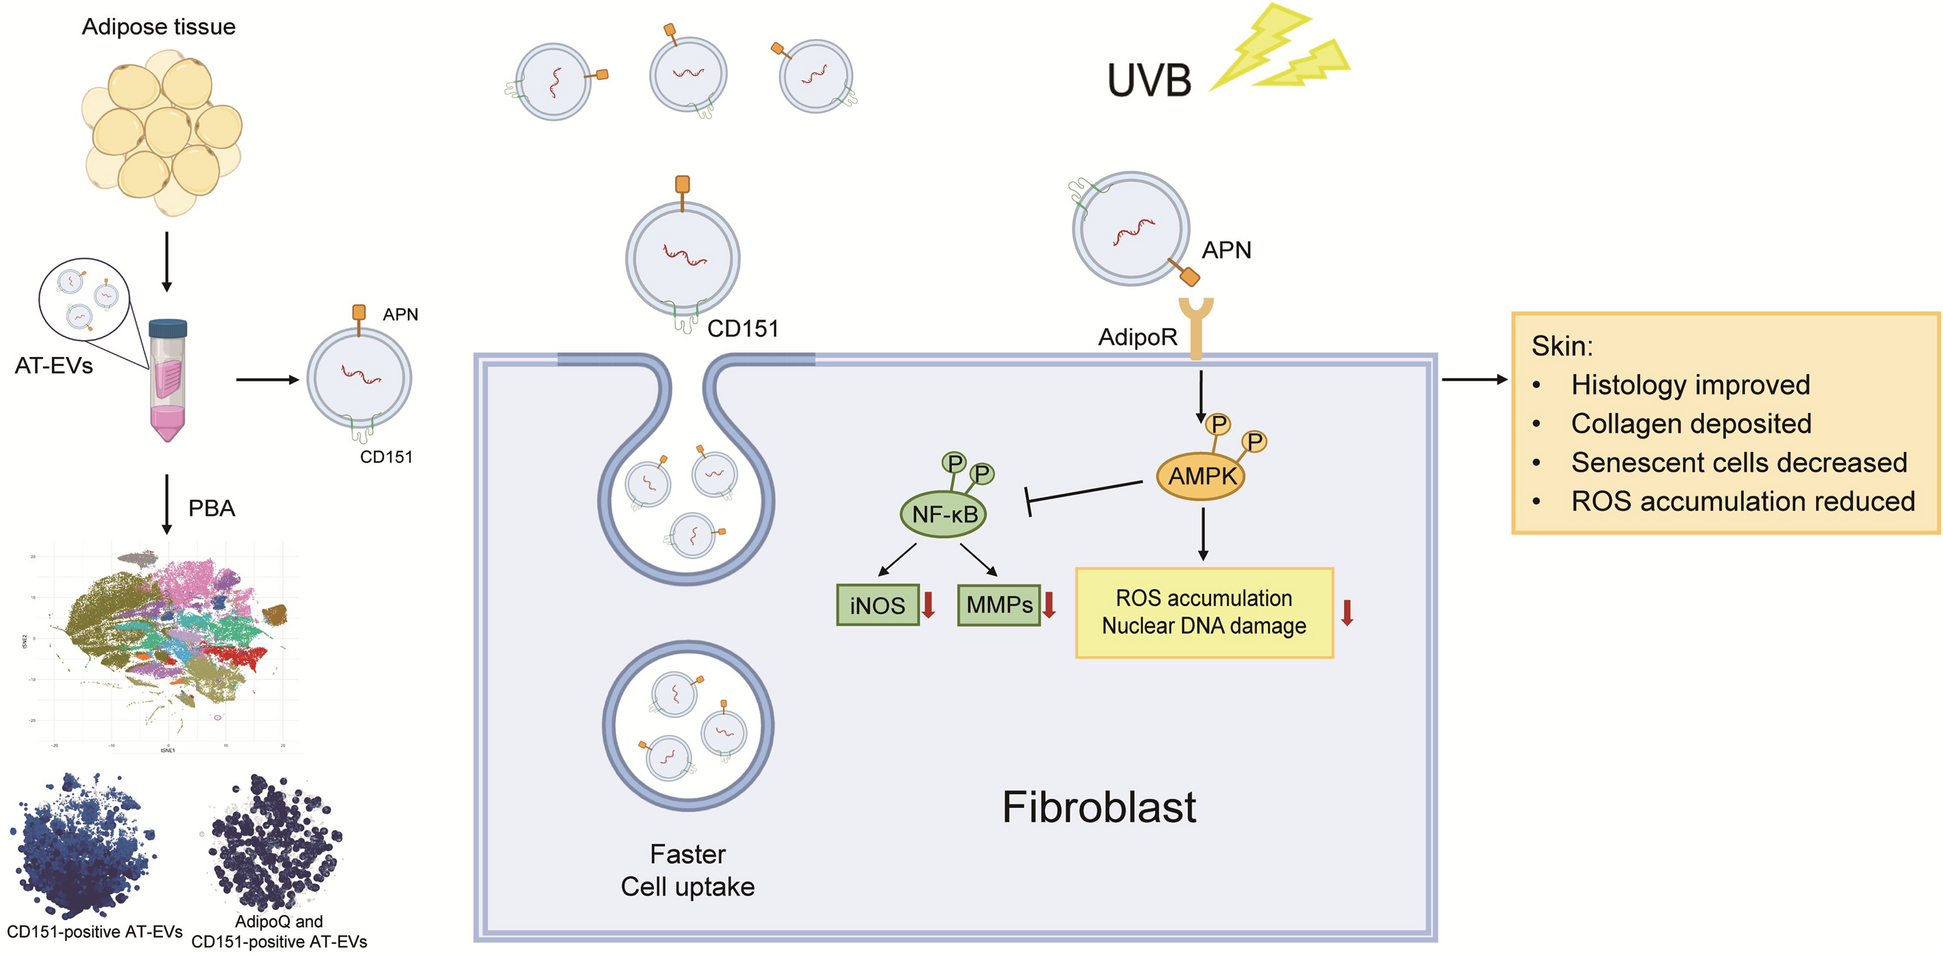
Adiponectin on the surface of AT-EVs activates the AMPK pathway to alleviate photoagingWe hypothesized that AT-EVs protect cells through APN during UVB exposure. To test this hypothesis, we constructed NIH3T3 cells with AdipoR knockdown (NIH3T3-shAdipoR) and treated them with ADSC-EVs and AT-EVs, with grouping and intervention, as shown in Fig. 5a. WB analysis confirmed the increased APN levels in AT-EVs (Fig. S14). We used lentiviruses to knock down AdipoR1 and AdipoR2 in NIH3T3 cells (Fig. 5b, c), and WB analysis revealed significantly reduced AdipoR expression in the NIH3T3-shAdipoR group (Fig. 5d, e). WB analysis revealed a decreased ratio of phosphorylated 5′AMP-activated protein kinaseT172 (p-AMPKT172) to total AMPK (t-AMPK) in both the shNC and shAdipoR-AT-EV groups following UVB irradiation. Conversely, pretreatment with AT-EVs mitigated the UVB-induced reduction in p-AMPKT172 (Fig. 5f, g). We subsequently investigated the impact of AT-EVs on the activation of the NF-κB signalling pathway during UVB irradiation. Although the differences between the groups were not significant, WB analyses revealed that both AT-EVs and ADSC-EVs tended to inhibit the increase in p-NF-κB p65S536 levels (Fig. 5f, g). iNOS, which is downstream of the NF-κB pathway, had lower expression in the shNC-AT-EV group than in the shAdipoR-AT-EV group (Fig. 5f, g). Immunofluorescence analysis of γ-H2AX indicated reduced nuclear DNA damage in the shNC-AT-EV group (Fig. 5h, i). These results demonstrate that APN on AT-EVs can activate AdipoR, stimulate the AMPK pathway, inhibit the NF-κB pathway, reduce UVB-induced DNA damage, and protect cells from UVB exposure.
Fig. 5
APN on the surface of AT-EVs alleviates photoaging by activating the AMPK pathway in cells. a Schematic diagram of the intervention in each group. b, c mRNA expression of AdipoR1 and AdipoR2 in the NIH3T3-shNC group and NIH3T3-shAdipoR group. d, e The protein expression of AdipoR in the NIH3T3-shNC group and NIH3T3-shAdipoR group. f, g The protein expression of iNOS and the phosphorylation levels of AMPK and NF-κB in the five groups. h, i Immunofluorescence staining of γ-H2AX in the cell nucleus in the five groups. Scale bars = 50 μm. *p < 0.05, **p < 0.01, ***p < 0.001, n.s., no significant difference between groups
CD151, which is highly expressed on the surface of AT-EVs, increases the cellular uptake of EVsWe investigated whether the mechanism underlying the increased uptake of AT-EVs is facilitated by the increased expression of CD151. Surface protein sequencing and WB analysis confirmed that CD151 expression was greater on AT-EVs than on ADSC-EVs (Fig. 6a). The NIH3T3 cells treated with 400 μg/ml PKH26-labelled ADSC-EVs or AT-EVs for 30 min presented increased intracellular red fluorescence in the AT-EV group (Fig. 6b, c), suggesting faster cellular uptake of AT-EVs. Moreover, the NIH3T3 cells in the AT-EV group expressed more CD151 (Fig. 6b, d). Time-lapse uptake recordings (Supplementary Material 4,5) revealed that AT-EVs were internalized earlier than ADSC-EVs were internalized, with a first appearance at 2 min 40 s for AT-EVs and 18 min 54 s for ADSC-EVs (Fig. S15) and a peak fluorescence at 21 min 24 s for AT-EVs and 40 min 13 s for ADSC-EVs (Fig. S16), indicating quicker AT-EV cellular uptake and potential for earlier regulatory effects.
Fig. 6
AT-EVs with high expression of CD151 can be more rapidly taken up by cells. a The protein expression of CD151 in AT-EVs and ADSC-EVs. b PKH26 and immunofluorescence staining of CD151 in cells after incubation with PKH26-labelled ADSC-EVs or AT-EVs for 30 min. Scale bars = 5 μm. c, d Quantification of PKH26 and CD151 fluorescence in the AT-EV group and ADSC-EV group. e Sorting of CD151( +) AT-EVs and CD151(-) AT-EVs from AT-EVs. f CD151 expression in CD151( +) AT-EVs and CD151(-) AT-EVs. g PKH26 and immunofluorescence staining of CD151 in cells after incubation with PKH26-labelled CD151( +) AT-EVs and CD151(-) AT-EVs for 30 min. Scale bars = 5 μm. h, i Intracellular PKH26 and CD151 fluorescence statistics. **p < 0.01, ***p < 0.001. (Created with BioRender.com)
To investigate whether the expression of CD151 on AT-EVs facilitates faster cellular uptake than that on ADSC-EVs, we isolated CD151-positive AT-EVs from CD151-negative AT-EVs via magnetic beads (Fig. 6e). WB analysis confirmed the effectiveness of the sorting process (Fig. 6f). Both types of EVs were labelled with PKH26 and incubated with NIH3T3 cells for 30 min. Cells treated with CD151-positive AT-EVs presented increased red fluorescence, indicating faster uptake of EVs (Fig. 6g, h), as well as elevated CD151 expression (Fig. 6g, i). These findings suggest that CD151 can promote the internalization of EVs by cells.
Comments (0)