Cell culture and transfection
Madin-Darby canine kidney (MDCK, CCL-34) and human bronchial epithelial (BEAS-2B, CRL-9609) cells were obtained from American Type Culture Collection (Manassas, VA, USA). Cells were maintained in a humidified atmosphere of 5% CO2 at 37 °C in Dulbecco’s modified Eagle’s medium (DMEM; Sigma-Aldrich, St. Louis, MO, USA) supplemented with 10% fetal bovine serum (Capricorn Scientific, Ebsdorfergrund, Germany). Expression plasmids were introduced into MDCK, or BEAS-2B cells by transfection for 24 h using FuGENE HD (Promega, Madison, WI, USA) or Polyethylenimine “Max” (PEI MAX; Polyscience, Warrington, PA, USA). The absence of Mycoplasma contamination was confirmed using a PCR Mycoplasma Test Kit (Takara Bio, Kusatsu, Japan). MDCK and BEAS-2B cells were cultured in Matrigel (BD Biosciences, Franklin Lakes, NJ, USA) in a 35-mm-glass-base dish every 6 and 5 days, respectively, to prepare 3D monolayers.
Purification of viruses
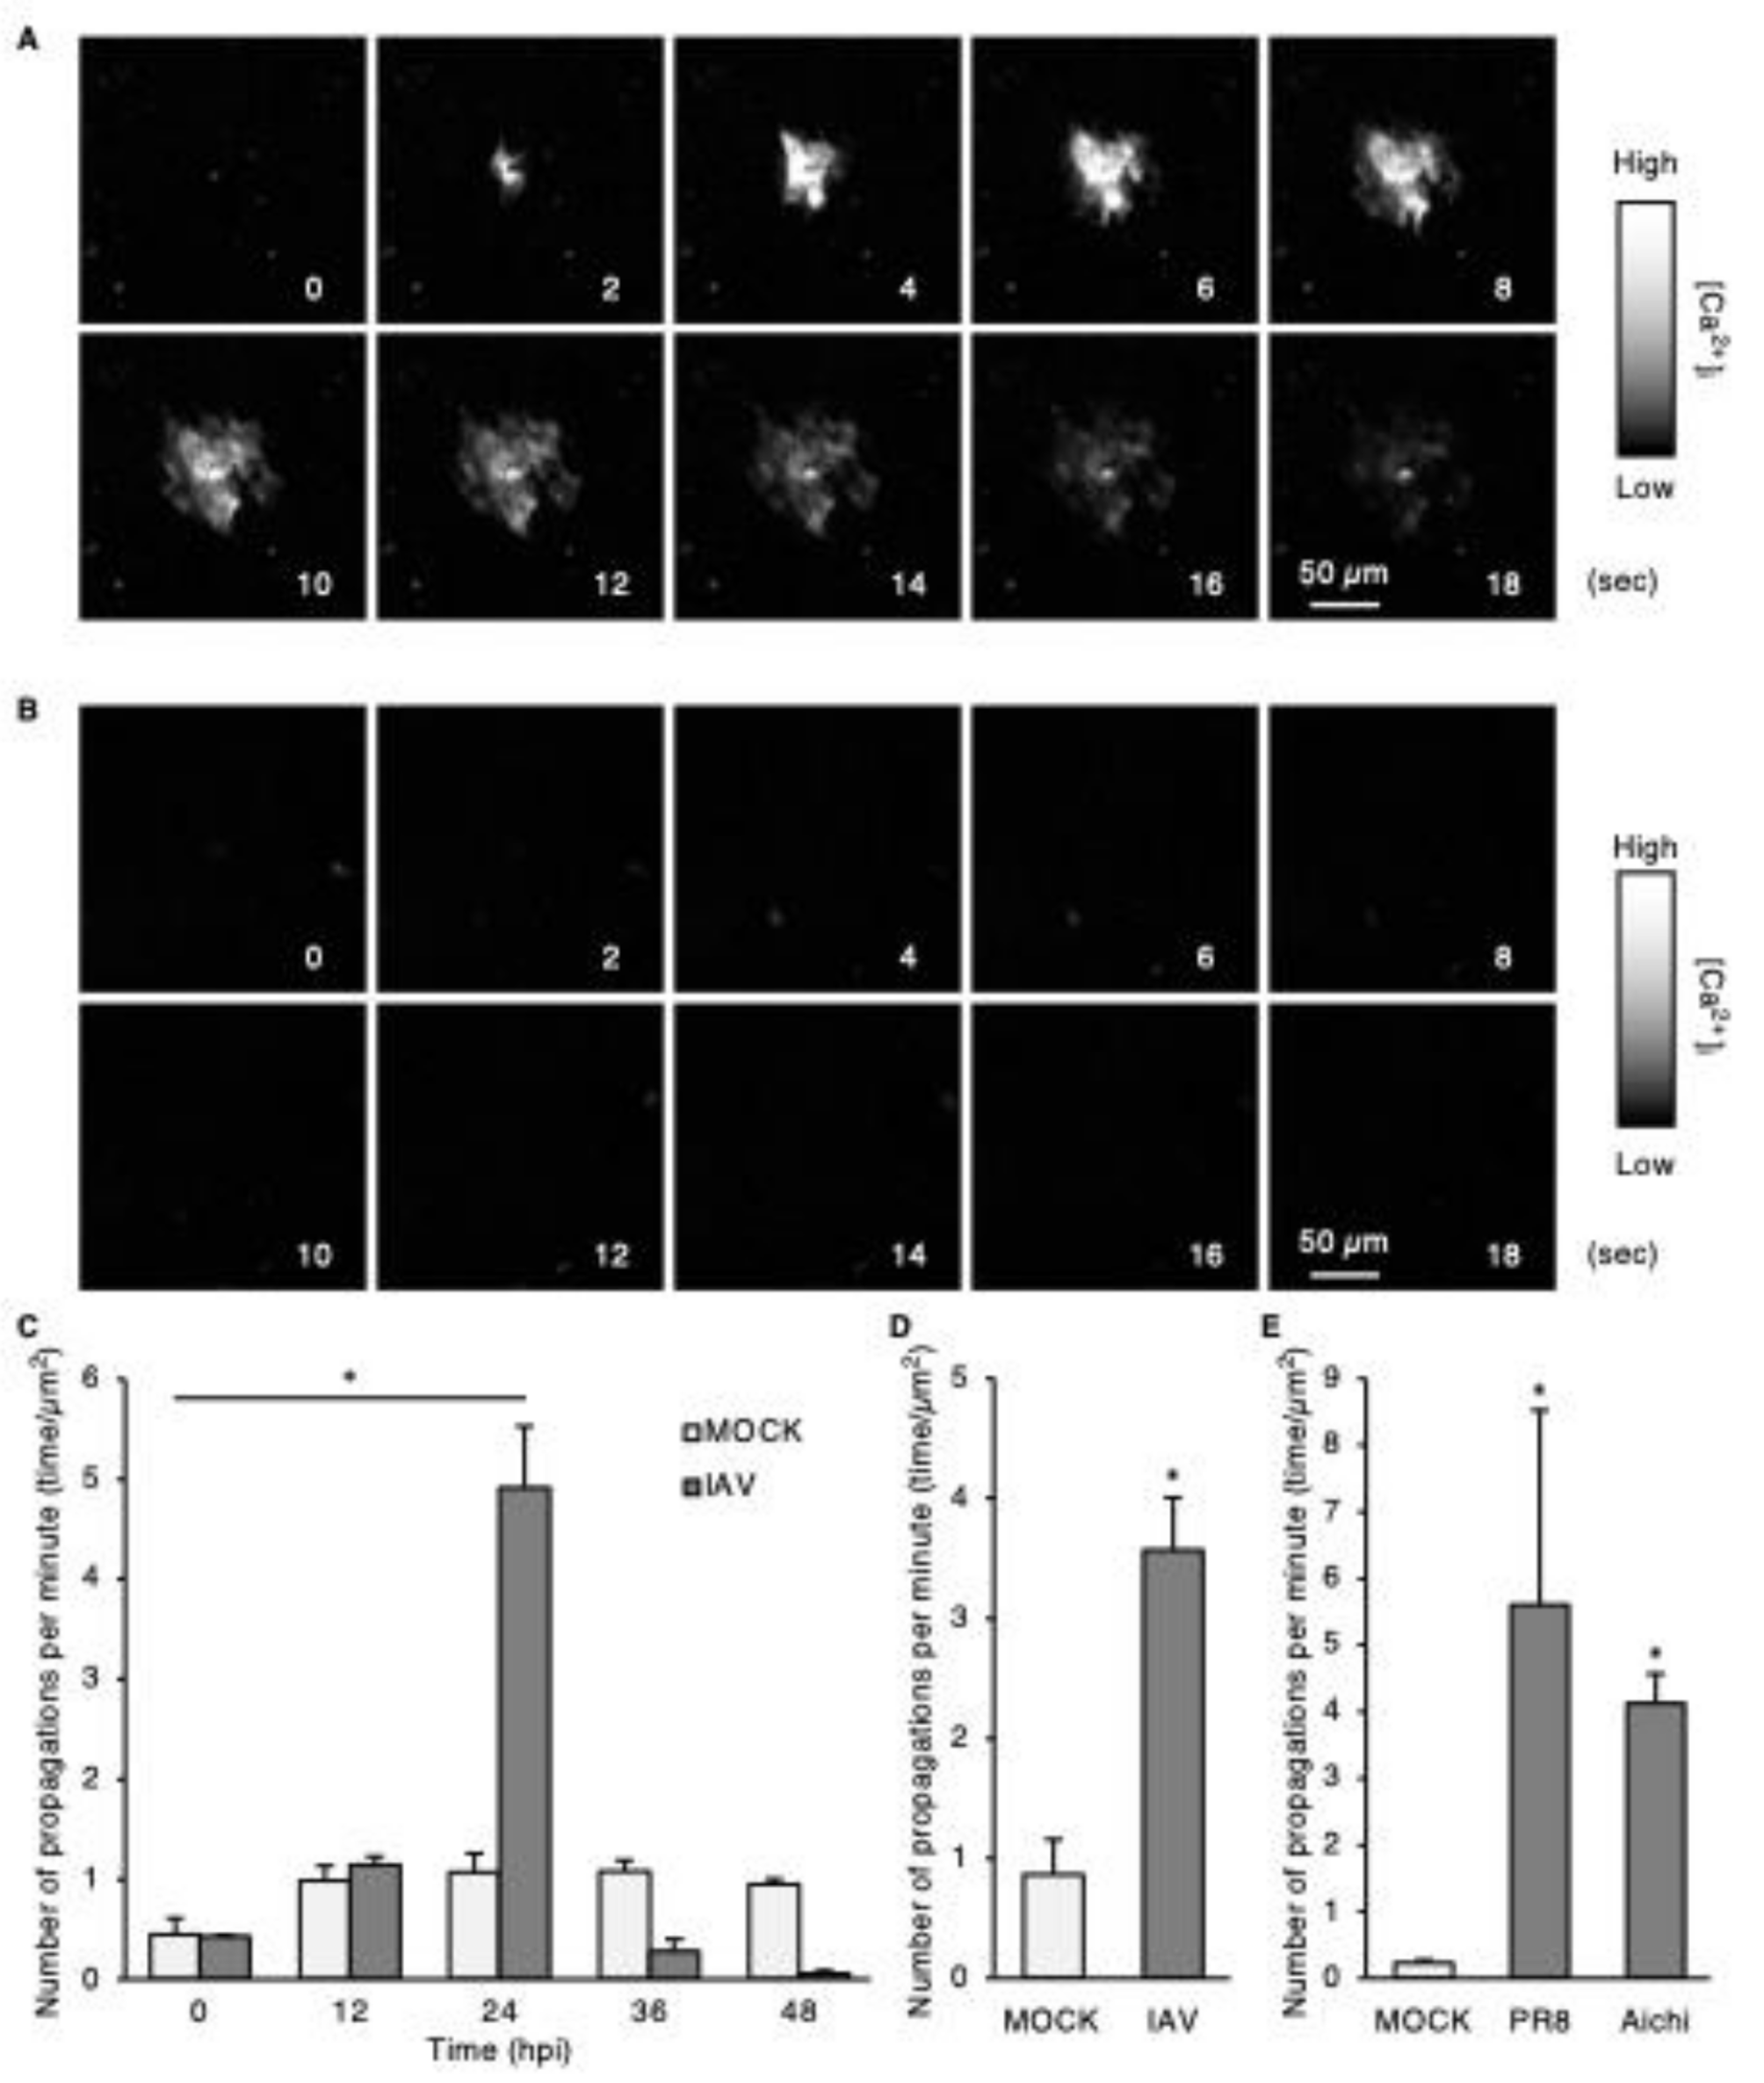
MDCK cells were infected with IAV strains A/Puerto Rico/8/34 (H1N1; PR8) or A/Aichi/2/68 (H3N2; Aichi) at a multiplicity of infection (MOI) of 0.0001 plaque-forming unit per cell (PFU/cell) for 48 h at 35 °C. The culture medium was centrifuged to remove cell debris, and the supernatant was collected. The viruses isolated by ultra-highspeed centrifugation were resuspended in phosphate-buffered saline (PBS) and stored at -80 °C until use. The titers of the infectious viruses in virus solution or culture media were determined using a plaque assay [27]. In brief, a conditioned medium of virus-infected cells was inoculated into confluent MDCK cell monolayers in 12-well plates; after 1 h of inoculation, the supernatants were removed, and cells were incubated with minimal essential medium containing 1% Bacto-agar (Sigma-Aldrich) and trypsin (5 mg/ml, Sigma-Aldrich). Plaques were counted after incubation for 2 days at 35 °C under 5% CO2.
Reagents and antibodies
Antibody against IAV nucleoprotein (NP, #GTX125989) was obtained from GeneTex (Irvine, CA, USA). The P2Y2 antagonist AR-C 118925XX (#216657-60-2) and P2Y1 antagonist 1-(2-(2- tert-butylphenoxy)pyridin-3-yl)-3-(4-(trifluoromethoxy)phenyl)urea (BPTU; BMS-646786, #870544-59-5) were obtained from Tocris Bioscience (Bristol, UK). Apyrase grade VI (#A6410), apyrase grade VII (#A6535), acetoxymethyl ester of 1,2-bis(2-aminophenoxy) ethane-N, N,N’,N’-tetraacetic acid (BAPTA-AM, #A-1076), and RITC-Dextran (#R9379) were purchased from Sigma-Aldrich, and 18β-glycyrrhetinic acid was obtained from Santa Cruz Biotechnology (Dallas, TX, USA). Hoechst 33342, Alexa Fluor 546-conjugated transferrin (#T23364), carbocyanine dyes (DiO, DiI, and DiD), Alexa Fluor 488-labeled antibodies to mouse (#AB_2534069) or rabbit (#AB_2633280) immunoglobulin G, and Alexa Fluor 647-labeled antibodies to mouse (#AB_2535804) or rabbit (#AB_2535813) immunoglobulin G were obtained from Thermo Fisher Scientific (Carlsbad, CA, USA). Matrigel (Cat#256237) was obtained from BD Biosciences. CGP37157 (#HY-15754) and venetoclax (#GDC-0199) were obtained from MedChem Express (Monmouth, NJ, USA). Cyclosporin A (#C2408), oseltamivir phosphate (#GS-4104), NPE-caged-ADP, antibodies against P2Y1 (#ER-14-1010), antibodies against β-actin (#010-27841), Horseradish peroxidase (HRP)-conjugated goat secondary antibodies against mouse/rabbit immunoglobulin G, and trypsin were obtained from Tokyo Chemical Industry (Tokyo, Japan), Cayman Chemical (Ann Arbor, MI, USA), Jena Bioscience (Malchin, Germany), RayBiotech (Peachtree Corners, GA, USA), FUJIFILM Wako (Osaka, Japan), Jackson ImmunoResearch Laboratories (West Grove, PA, USA), and FUJIFILM Wako, respectively. MRS 2211 (2-[(2-chloro-5-nitrophenyl)azo]-5-hydroxy-6-methyl-3-[(phosphonooxy)methyl]-4-pyridinecarboxaldehyde disodium salt and MRS 2395 (2,2-dimethyl-propionic acid 3-(2-chloro-6-methylaminopurin-9- yl)-2-(2,2-dimethyl-propionyloxymethyl)-propyl ester) were obtained from Merck (Darmstadt, Germany).
Plasmids
The expression vector for pCX4puro-CRY2-CRaf [28] was generously provided by Dr. K. Aoki (National Institute for Basic Biology, Okazaki, Japan). The expression vector pCMV-O-GECO1 was purchased from Addgene (Cambridge, MA, USA). pCMV-O-GECO1 was digested with BamHI and NotI. The resulting DNA fragment (the coding sequence of O-GECO1) was subcloned between the BamHI and NotI sites of pCX4puro-CRY2-CRaf to obtain pCX4puro-O-GECO1. The coding sequences for HA and M2 were amplified from pCAGGS-HA and pCAGGS-M2 [29], obtained from Dr. Y. Kawaoka, using the primer pairs HA_F (5’-GGGTCGACGCCACCATGAAGGCAAACCTACTGG-3’) and HA_R (5’-TAGCGGCCGCTCAGATGCATATTCTGC-3’), and M2_F (5’-ATCTCGAGGCCACCATGAGCCTTCTAACCGAGGTC-3’) and M2_R (5’-TAGCGGCCGCTGCTTACTCCAGCTCTATGCTG-3’), respectively. The resulting PCR products for HA and M2 were digested with SalI/NotI and XhoI/NotI, respectively, and then subcloned between the XhoI and NotI sites of pCXN2-Flag-HRas-IRES-EGFP to obtain pCXN2-Flag-HA-IRES-EGFP and pCXN2-Flag-M2-IRES-EGFP. The expression vector for the A27F mutant of M2 was obtained by PCR-based mutagenesis using a QuickChange Site-directed mutagenesis kit (Agilent, Santa Clara, CA, USA) and with primers:
5’-GTGATCCTCTCTTTATTGCCGCAAATATC-3’ and
5’-GATATTTGCGGCAATAAAGAGAGGATCAC-3’.
Generation of stable cell lines
pCX4puro-O-GECO1 was linearized with ScaI and introduced into BEAS-2B and MDCK cells by transfection using PEI MAX for 24 h. Cells were then cultured in DMEM supplemented with 10% fetal bovine serum and puromycin, and positive colonies were selected after 14 days. Cloned cells were selected using puromycin after every five passages.
Fluorescence microscopy
Fluorescence imaging and data analysis were performed as previously described [30, 31]. Briefly, cells were placed in a stage-top incubation chamber maintained at 37 °C on a Nikon Eclipse Ti2-E microscope (Nikon, Tokyo, Japan) equipped with a KINETIX22 scientific complementary metal oxide semiconductor (sCMOS) camera (Teledyne Photometrics, Tucson, AZ, USA), PlanApo 4×, 10×, 20×, or 60× objective lenses, a TI2-CTRE microscope controller (Nikon), and a TI2-S-SE-E motorized stage (Nikon). Cells were illuminated using an X-Cite Turbo system (Excelitas Technologies, Waltham, MA, USA). The sets of excitation and emission filters and dichroic mirrors adopted for this observation included GFP HQ (Nikon) for EGFP, Cy3 HQ (Nikon) for mCherry, or DAPI-U HQ (Nikon) for Hoechst 33342. For live-cell imaging, cells were incubated at 37 °C using a Chamlide incubator system (Live Cell Instrument, Seoul, Republic of Korea).
Confocal and super-resolution images were acquired using an X-Light V3 spinning disk confocal unit (CrestOptics, Roma, Italy) and DeepSIM (CrestOptics) for Eclipse Ti2 equipped with a Prime BSI sCMOS camera (Teledyne Photometrics), respectively. Cells were illuminated using CELESTA light engines (Lumencor; NW Greenbrier Parkway Beaverton, OR, USA).
AMATERAS imaging
Imaging using an AMATERAS-1 system was performed as previously described [32]. A CMOS camera (VCC-120CXP1M; CIS, Tokyo, Japan) with a 120-megapixel image sensor (120MXSM; Canon, Tokyo, Japan) was used. A 2× macro lens (LSTL20H-F; Myutron, Tokyo, Japan) was used as the imaging lens. A high-power LED with a center wavelength of 525 nm (SOLIS-525 C; Thorlabs, Newton, NJ, USA) was used for fluorescence imaging of O-GECO with an excitation filter (# 86–963; Edmund Optics, Barrington, NJ, USA) and a fluorescence filter (#67 − 048; Edmund Optics). A stage-top incubator (U-140 A; BLAST, Kawasaki, Japan) was used to control the temperature and CO2 concentration at the sample stage. The sample stage position and angle were adjusted using three translation stages (TSD-651C25-M6, TSD-651 C-M6, and TASB-653-M6; OptoSigma, Tokyo, Japan) and two goniostages (GOHT-65A50BMS-M6 and GOHT-65A75 BMSR-M6; OptoSigma).
Frequency analysis of iCWPs
The fluorescence intensity of each pixel was measured over time, and the derivatives calculated. Binary images were generated for every time point by identifying pixels with a fluorescence intensity higher than that of the first plane, based on the differential coefficient of each pixel. Next, pixel aggregates having an area > 100 µm2 were automatically selected and enclosed with bounding boxes by the ImageJ module Analysis Particles. In consecutive planes, quadrilaterals with a distance ≤ 12 μm between bounding boxes were grouped together as a single population. The areas of the aggregates were measured over time, and a population with a maximum area > 500 µm2 (equivalent to 4 cells) was counted as a single wave propagation.
Alternatively, for the images captured using AMATERAS, cell populations with increased fluorescence intensity were detected by Igor Pro v.8.04 (WaveMetrics, Portland, OR, USA), and those with an area > 500 µm2 were identified as waves. Next, the images were segmented into 200 × 200 μm square compartments (40,000 µm2). The number of waves within each compartment was integrated for 600 s and displayed on a color map.
Immunofluorescence-based virus infection assay
Immunofluorescence-based viral internalization and infection assays were performed as previously described [9, 11]. In brief, cells were incubated with viruses for 4 h at 37 °C, fixed with 3% PFA for 15 min at 25 °C, and incubated with 1% bovine serum albumin to block nonspecific binding of antibodies. Cells were further incubated overnight at 4 °C with anti-IAV NP antibodies (1:1000 dilution), after which the immune complexes were detected by incubation with Alexa Fluor 488- or Alexa Fluor 647-conjugated secondary antibodies (1:250 dilution) for 1 h at room temperature in the dark. Nuclei were visualized using Hoechst 33342. Images were acquired using a Nikon Ti2 microscope (Nikon, Tokyo, Japan). In some experiments, an ImageJ module Curve Fitting was used to fit the datasets to the Hill equations.
Dispersity analysis of infected cells
Confluent monolayers of MDCK cells in 35-mm dishes were treated with BPTU or DMSO for 1 h before exposure to IAV. After 30 h of inoculation with IAV, cells were fixed with 3% PFA and subjected to an immunofluorescence-based viral infection assay to identify infected cells. Dispersion was determined by measuring the distance between centers of gravity of the infected cell nuclei as follows: First, the center of gravity of each infected cell nucleus was identified using the ImageJ module Analyze particles. Next, the distance from the center of gravity of each infected cell nucleus to that of the nearest infected cell nucleus was measured (measured values). The frequency of the distances obtained was plotted on a histogram. Alternatively, cells equal in number to infected cells were assigned random center-of-gravity coordinates and arranged on the xy-plane. The distances between their nuclei were measured and plotted in the same manner (calculated values). The median values of distances obtained from actual images and images with randomly allocated cells were compared (Student’s t-test).
Endocytosis assay
To evaluate clathrin-independent endocytosis, MDCK cells plated on collagen-coated glass-bottom dishes (35-mm-diameter; Matsunami Glass Industry Glass, Osaka, Japan) were incubated with Alexa Fluor 546-conjugated dextran (100 µg/mL) for 30 min at 37 °C, followed by thorough washing with PBS to remove noninternalized substances. Visualized vesicles were extracted using the ‘granularity’ function of MetaMorph software (Molecular Devices, San Jose, CA, USA), and the fluorescence intensity of vesicles was quantified.
Quantification of viral RNA by quantitative PCR (qPCR) analysis
Total RNA was isolated from IAV-infected cells using a QIAamp Viral RNA Mini Kit (Qiagen, Venlo, Netherlands). IAV-infected lung tissues were subjected to total RNA extraction using a PureLink RNA Mini Kit (Thermo Fisher Scientific). Portions of RNA (2.0 µg) was subjected to reverse transcription using SuperScript VILO Reverse Transcriptase (Thermo Fisher Scientific). qPCR analysis was performed using a StepOne real-time PCR system (Thermo Fisher Scientific) with the following primers for the IAV M gene:
5’-CCMAGGTCGAAACGTAYGTTCTCTCTATC-3’,
5’-TGACAGRATYGGTCTTGTCTTTAGCCAYTCCA-3’, and
probe 5’-FAM-TGACAGRATYGGTCTTGTCTTTAGCCAYTCCA-BHQ1-3’.
RNA interference
The siRNAs targeting dog P2Y1 mRNA (siP2Y1#1 and siP2Y1#2) were obtained from Nippon Gene (Tokyo, Japan). Their sequences were as follows: siP2Y1#1, sense: 5’-CAUCUCCGUGUACAUGUUCAACC-3’; antisense: 5’-CAGGUUGAACAUGUACACGGAGAUGCC-3’. siP2Y1#2, sense: 5’-AGCGAGGACAUGACCCUCAACAU-3’; antisense: 5’-AAAUGUUGAGGGUCAUGUCCUCGCUCU-3’. MDCK cells were transfected with 30 µM siRNAs using Lipofectamine RNAiMAX reagent (Thermo Fisher Scientific) according to the manufacturer’s instructions.
Immunoblot analysis
Transfected MDCK cells were lysed in lysis buffer [10 mM Tris-HCl (pH 7.4), 150 mM NaCl, 5 mM EDTA, 0.5% NP-40, 10% glycerol, 1 mM NaF, 1 mM Na3VO4, 1 mM phenylmethylsulfonyl fluoride, 10 µg/ml aprotinin, and 10 µg/ml leupeptin] by incubation for 30 min on ice. The lysates were centrifuged at 20,000 × g for 10 min at 4 °C, and the resulting supernatants were subjected to SDS-polyacrylamide gel electrophoresis. The separated proteins were transferred to a polyvinylidene difluoride membrane (Merck) and analyzed by immunoblotting. The membrane was exposed overnight at 4 °C to primary antibodies [anti-P2Y1 (1:1000 dilution) and anti-β-actin (1:2000 dilution)], followed by incubation for 1 h at room temperature with HRP-conjugated secondary antibodies (1:5000). Immune complexes were detected with the use of ECL Western Blotting Detection Reagent (Cytiva, Tokyo, Japan) and a MIIS imaging system (Givetechs, Sakura, Japan).
Animal experiments
Six-week-old male BALB/C mice were purchased from Japan SLC Inc. (Shizuoka, Japan). Mice were infected by direct delivery of PR8 (50 PFU) to the nares using a micropipette under isoflurane anesthesia, as previously described [9]. Mice were separately housed for 2 days after virus exposure. BPTU and oseltamivir were dissolved in 5% sucrose solution and adjusted to 16 and 40 mg·kg− 1·day− 1, respectively. Mice were intraperitoneally administered these agents or PBS daily for 1 day prior to virus exposure. RNA was extracted from the collected lungs, and viral RNA copy number was determined using qPCR, as described above.
Quantification and statistical analysis
Quantitative data are presented as mean + standard error (SEM) of at least three independent experiments, except for an animal experiment, and were compared using Student’s t-test (parametric test between two conditions) or one-way analysis of variance (ANOVA) followed by Dunnett’s post hoc test (among multiple conditions). No statistical methods were used to predetermine sample size. All experiments were performed unblinded. A p-value < 0.05 was considered statistically significant, and all statistical analyses were performed using JMP Pro software v.16.0.0 (SAS Institute Inc., Cary, NC, USA).


Comments (0)