
Remember me


The targets of IBD, APN deficiency, AdipoR1 deficiency and AdipoR2 deficiency are firstly screened from GeneCards database, and then intersection targets between them are determined through Venn diagrams (Fig. 4A). Subsequently, their interaction networks are analyzed by STRING database and functional enrichment is acquired through Gene ontology (GO), canonical pathways and Kyoto Encyclopedia of Genes and Genomes (KEGG) pathways. Finally, interaction sites are predicted by molecular docking.
Fig. 4
Venn and interaction network of adiponectin, AdipoR1, AdipoR2 and inflammatory bowel disease targets. (A) Target screening scheme; (B) Venn; (C) number of targets; (D) number of total targets in APN + AdipoR1 + AdipoR2 + IBD, APN + AdipoR1 + IBD and APN + AdipoR2 + IBD; (E) number of targets with APN relevance score ≥ 10 in APN + AdipoR1 + AdipoR2 + IBD, APN + AdipoR1 + IBD and APN + AdipoR2 + IBD; (F-K) top 10 targets with highest sting node degrees; (L, N, P) interaction network of human APN + AdipoR1 + AdipoR2 + IBD, APN + AdipoR1 + IBD and APN + AdipoR2 + IBD targets with APN relevance score ≥ 10, IBD relevance score ≥ 50 and top 10 highest sting node degrees; (M, O, Q) interaction network of mouse APN + AdipoR1 + AdipoR2 + IBD, APN + AdipoR1 + IBD and APN + AdipoR2 + IBD targets with APN relevance score ≥ 10, IBD relevance score ≥ 50 and top 10 highest sting node degrees; (R-W) sting node degrees of human and mouse APN + AdipoR1 + AdipoR2 + IBD, APN + AdipoR1 + IBD, APN + AdipoR2 + IBD targets with APN relevance score ≥ 10 and IBD relevance score ≥ 50. The targets of IBD, APN deficiency, AdipoR1 deficiency and AdipoR2 deficiency are acquired from GeneCards database. The interaction networks are analyzed by STRING database. APN: adiponectin; AdipoR1: adiponectin receptor 1; AdipoR2: adiponectin receptor 2; IBD: inflammatory bowel disease; INS: insulin; GAPDH: glyceraldehyde-3-phosphate dehydrogenase; PPARG: peroxisome proliferator activated receptor gamma; AKT1: AKT serine/threonine kinase 1; ALB: albumin; IL: interleukin; TNF: tumor necrosis factor; PPARA: peroxisome proliferator activated receptor alpha; TP53: tumor protein P53; LEP: leptin; PPARGC1α: PPARG coactivator 1 alpha; SIRT1: sirtuin 1; FOXP3: forkhead box protein P3; CXCL: C-X-C motif chemokine ligand; CXCR4: C-X-C motif chemokine receptor 4; CTNNB1: catenin beta 1; IL2RA: interleukin 2 receptor subunit alpha; CRP: C-reactive protein; NLRP3: NLR family pyrin domain containing 3; BMP2: bone morphogenetic protein 2; BGLAP: bone gamma-carboxyglutamate protein; CSF2: colony stimulating factor 2; NOD2: nucleotide binding oligomerization domain containing 2; APOE: apolipoprotein E; VWF: Von Willebrand factor; TIMP1: TIMP metallopeptidase inhibitor 1; TGFB1: transforming growth factor beta 1; SCARB: scavenger receptor class B member; CASP3: caspase 3; APOA1: apolipoprotein A1; ACE: angiotensin I converting enzyme; CETP: cholesteryl ester transfer protein; AGT: angiotensinogen; PLG: plasminogen. Available (November 2024): https://www.genecards.org/; https://cn.string-db.org/cgi/input?sessionId=bBSQf0gz7Y6u&input_page_show_search=on
Target screeningTarget intersection of APN and IBD is enormous. The targets of IBD, APN deficiency, AdipoR1 deficiency and AdipoR2 deficiency are acquired from GeneCards database, whose quantities after eliminating duplicate values are 10,339, 1473, 3293 and 3402 (Fig. 4B-C). The numbers of intersection targets of APN + AdipoR1 + AdipoR2 + IBD, APN + AdipoR1 + IBD and APN + AdipoR2 + IBD are 356, 46 and 89 (Fig. 4B-D). Excluding the intersection with AdipoR1 or AdipoR2, the amount of intersection targets between IBD and APN is 662 (Fig. 4B-C). Top 10 targets of APN + AdipoR1 + AdipoR2 + IBD (Table S1) are adiponectin, C1Q and collagen domain containing [ADIPOQ, relevance score (RS) = 149.4171448], acyl-CoA dehydrogenase very long chain (ACADVL, RS = 96.89267731), carnitine palmitoyltransferase 2 (CPT2, RS = 91.03253174), adenosine deaminase (ADA, RS = 77.02828217), solute carrier family 2 member 1 (SLC2A1, RS = 74.02565002), dihydrolipoamide dehydrogenase (DLD, RS = 73.75358582), methylenetetrahydrofolate reductase (MTHFR, RS = 67.14596558), carnitine palmitoyltransferase 1 A (CPT1A, RS = 63.20038605), leptin (LEP, RS = 61.27810669) and arylsulfatase A (ARSA, RS = 54.54859161). Similarly, top 10 targets of APN + AdipoR1 + IBD except APN + AdipoR1 + AdipoR2 + IBD (Table S2) are interleukin 2 receptor subunit alpha (IL2RA, RS = 38.22231674), CRP (RS = 28.32578087), NLR family pyrin domain containing 3 (NLRP3, RS = 16.74045563), C-X-C motif chemokine receptor 4 (CXCR4, RS = 16.13383293), nucleotide binding oligomerization domain containing 2 (NOD2, RS = 15.06386757), TNF receptor superfamily member 11b (TNFRSF11B, RS = 14.31340408), RUNX Family Transcription Factor 1 (RUNX1, RS = 13.18826866), Wolframin ER transmembrane glycoprotein (WFS1, RS = 12.76303864), catenin beta 1 (CTNNB1, RS = 12.62774658) and bone morphogenetic protein 2 (BMP2, RS = 10.8545351). Top 10 targets of APN + AdipoR2 + IBD except APN + AdipoR1 + AdipoR2 + IBD (Table S3) are JAK3 (RS = 66.93528748), lecithin-cholesterol acyltransferase (LCAT, RS = 36.63467789), Von Willebrand factor (VWF, RS = 24.57114792), solute carrier family 17 member 5 (SLC17A5, RS = 24.19079781), lysosomal associated membrane protein 2 (LAMP2, RS = 23.16798019), fibrillin 1 (FBN1, RS = 19.23112297), transforming growth factor beta 1 (TGFB1, RS = 19.12390709), ATP binding cassette subfamily G member 5 (ABCG5, RS = 18.88196945), serpin family F member 1 (SERPINF1, RS = 18.5030632) and microsomal triglyceride transfer protein (MTTP, RS = 18.08280373).
Construction and analysis of interaction networkCore proteins of the interaction network are not necessarily in top 10 RS targets. The APN + AdipoR1 + AdipoR2 + IBD, APN + AdipoR1 + IBD and APN + AdipoR2 + IBD targets with APN RS ≥ 10 are selected for interaction network Table S1-S3). Top 10 targets with highest sting node degrees (SND) of Homo sapiens APN + AdipoR1 + AdipoR2 + IBD (Fig. 4F, Figure S17 and Table S4) are insulin (INS, SND = 108), glyceraldehyde-3-phosphate dehydrogenase (GAPDH, SND = 99), AKT serine/threonine kinase 1 (AKT1, SND = 93), peroxisome proliferator-activated receptor gamma (PPARG, SND = 93), albumin (ALB, SND = 90), IL6 (SND = 86), TNF (SND = 85), peroxisome proliferator-activated receptor alpha (PPARA, SND = 79), leptin (LEP, SND = 78) and tumor protein P53 (TP53, SND = 78), which is differed from PPARG coactivator 1 alpha (Ppargc1a, SND = 72) and sirtuin 1 (Sirt1, SND = 68) of mouse musculus APN + AdipoR1 + AdipoR2 + IBD (Fig. 4G, Figure S18 and Table S5). Top 10 targets with highest SND of Homo sapiens APN + AdipoR1 + IBD excepting APN + AdipoR1 + AdipoR2 + IBD (Fig. 4H, Figure S17 and Table S6) are IL6 (SND = 13), C-X-C motif chemokine ligand 10 (CXCL10, SND = 9), forkhead box protein P3 (FOXP3, SND = 9), CTNNB1 (SND = 8), CXCR4 (SND = 8), CRP (SND = 7), IL2RA (SND = 7), bone gamma-carboxyglutamate protein (BGLAP, SND = 6), BMP2 (SND = 6), NLRP3 (SND = 6) and RUNX1 (SND = 6), which is distinguished from colony stimulating factor 2 (Csf2, SND = 8), C-X-C motif chemokine 15 (Cxcl15, SND = 7), osteocalcin-2 (Bglap2, SND = 5), osteocalcin-3 (Bglap3, SND = 5) and Nod2 (SND = 4) of mouse musculus APN + AdipoR1 + IBD excepting APN + AdipoR1 + AdipoR2 + IBD (Fig. 4I, Figure S18 and Table S7). Top 10 targets with highest SND of Homo sapiens APN + AdipoR2 + IBD excepting APN + AdipoR1 + AdipoR2 + IBD (Fig. 4J, Figure S17 and Table S8) are apolipoprotein E (APOE, SND = 16), CRP (SND = 13), TGFB1 (SND = 13), TIMP metallopeptidase inhibitor 1 (TIMP1, SND = 13), VWF (SND = 13), apolipoprotein A1 (APOA1, SND = 12), Caspase 3 (CASP3, SND = 12), scavenger receptor class B member 2 (SCARB2, SND = 12), angiotensin I converting enzyme (ACE, SND = 12) and cholesteryl ester transfer protein (CETP, SND = 12), which is sifted out from (Agt, SND = 14), (Plg, SND = 13) and Il18 (SND = 13) of mouse musculus APN + AdipoR2 + IBD excepting APN + AdipoR1 + AdipoR2 + IBD (Fig. 4K, Figure S18 and Table S9). To further explore the interaction network between core targets and APN, targets with APN RS ≥ 10, IBD RS ≥ 50 and top 10 highest SND are used for subsequent analysis. IL6, TNF, TP53, INS, PPARG, ALB in APN + AdipoR1 + AdipoR2 + IBD (Fig. 4L-M and R-S), CRP, NLRP3, IL2RA, CTNNB1 in APN + AdipoR1 + IBD excepting APN + AdipoR1 + AdipoR2 + IBD (Fig. 4N-O and T-U) and TGFB1, VWF, ACE in APN + AdipoR2 + IBD excepting APN + AdipoR1 + AdipoR2 + IBD (Fig. 4P-Q and V-W) show highest correlation with APN, AdipoR1 and AdipoR2.
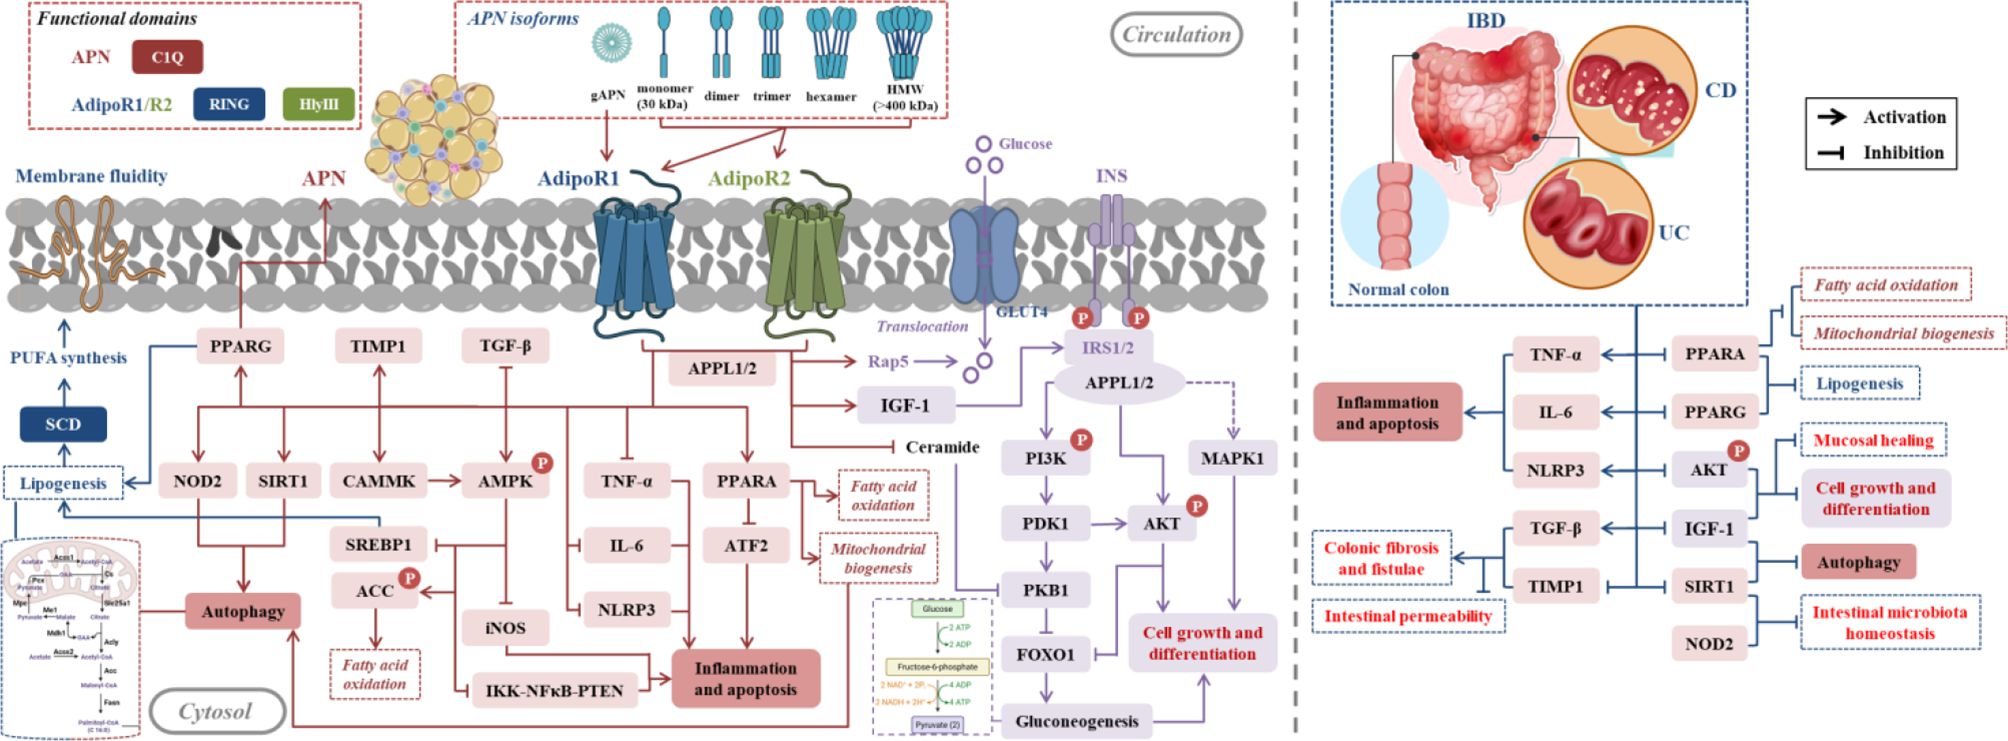
Preliminary analysis of intersection targetsAPN regulates CD through AdipoR1/2-metabolism process and UC through AdipoR1-inflammation axis or AdipoR2-fibrosis process. Intersection targets of APN + AdipoR1 + AdipoR2 + IBD are mainly based on metabolic factors INS, GAPDH, PPARG, AKT1, PPARA, PPARA in Homo sapiens and AKT1, PPARG, PPARA, PPARGC1α, SIRT1 in Mouse musculus, where less are inflammatory factors including TNF and IL6 in Homo sapiens or Mouse musculus (Fig. 4A and F-G). Most cross-targets of APN + AdipoR1 + IBD are inflammatory factors including IL6, FOXP3, CXCL10, CX CR4, IL2RA, CRP, NLRP3 in Homo sapiens and CSF2, CXCL5, IL2RA, CRP, NLRP3, CXCR4, NOD2 in Mouse musculus (Fig. 4A and H-I). Surprisingly, intersection targets of APN + AdipoR2 + IBD also involve fibrosis-related proteins TIMP1, TGFB1 in Homo sapiens and TIMP1, TGFB1, PLG in Mouse musculus except for inflammatory factors and metabolic factors (Fig. 4A and J-K). We speculate that APN may modulate metabolic process through AdipoR1/2, regulate immunity by AdipoR1, and adjust metabolic process, immunity and fibrosis process via AdipoR2, thereby interfering with IBD. Moreover, APN perhaps regulate CD through AdipoR1/2-metabolism process and UC through AdipoR1-inflammation process or AdipoR2-fibrosis process, because the symptoms of CD are closely related to metabolism [16, 18,19,20] and UC is intimately correlated to immunity/ colonic fibrosis [4, 14, 17, 21].
Functional enrichmentThe top 10 intersection targets does not closely match with first 10 core proteins of the interaction network, so functional enrichment is used to further explore the specific physiological functions of these targets. Meanwhile, APN + AdipoR1 + AdipoR2 + IBD, APN + AdipoR1 + IBD and APN + AdipoR2 + IBD targets with APN RS ≥ 10 are selected for Gene ontology (GO), canonical and Kyoto Encyclopedia of Genes and Genomes (KEGG) pathways enrichment.
GO enrichmentAPN perhaps interfere with cell communication, lipid, organic acid, oxygen-containing compounds, organonitrogen compounds and peptide hormone metabolism in IBD individuals through AdipoR1 or AdipoR2. Top 20 GO enrichment of both Homo sapiens (Fig. 5A) and mouse musculus (Fig. 5B) intersection targets of APN + AdipoR1 + AdipoR2 + IBD with APN RS ≥ 10 (Table S1) profoundly influences small molecule, lipid and organic acid metabolic process, cellular response to oxygen-containing compound, organonitrogen compound, chemical stimulus, peptide hormone and endogenous stimulus, homeostatic process, positive regulation of cell communication.
Fig. 5
GO (A-F), canonical pathways and KEGG pathways (G-L) enrichment of intersection targets. The APN + AdipoR1 + AdipoR2 + IBD (A-B, G-H), APN + AdipoR1 + IBD (C-D, I-J) and APN + AdipoR2 + IBD (E-F, K-L) targets with APN relevance score ≥ 10 are selected for GO, canonical pathways and KEGG enrichment. Top 20 GO enrichments are showed in the figures. GO: Gene ontology; KEGG: Kyoto Encyclopedia of Genes and Genomes; APN: adiponectin; AdipoR1: adiponectin receptor 1; AdipoR2: adiponectin receptor 2; IBD: inflammatory bowel disease. Available (November 2024): https://www.geneontology.org/; https://metascape.org/gp/index.html#/main/step1
Mechanism of APN in IBD through AdipoR1 without AdipoR2 may be attributed to neurologic and peripheral immune regulation. Top 20 GO enrichment of either Homo sapiens (Fig. 5C) or mouse musculus (Fig. 5D) intersection targets of APN + AdipoR1 + IBD with APN RS ≥ 10 (Table S2) excepting APN + AdipoR1 + AdipoR2 + IBD plays a key role on positive regulation of leukocyte, odontoblast, lymphocyte differentiation and activation, multicellular organismal development, hemopoiesis, negative regulation of immune system process. Homo sapiens APN + AdipoR1 + IBD targets also regulate T cell, neuroepithelial cell, glial cell differentiation and activation, cell adhesion, connective tissue development (Fig. 5C), while mouse musculus APN + AdipoR1 + IBD targets extra affect interleukin-18 production, cellular response to endogenous stimulus, localization and negative regulation of myeloid leukocyte differentiation (Fig. 5D).
APN potentially interfere with nutrition and energy homeostasis through AdipoR2 without AdipoR1, thus affecting the peripheral phylogeny of IBD. Top 20 GO enrichment of both Homo sapiens (Fig. 5E) and mouse musculus (Fig. 5F) intersection targets of APN + AdipoR2 + IBD with APN RS ≥ 10 (Table S3) excepting APN + AdipoR1 + AdipoR2 + IBD play a crucial part in lipid and chemical homeostasis, negative regulation of multicellular organismal process, response to hormone and organonitrogen compound. Moreover, Homo sapiens APN + AdipoR2 + IBD targets modulate cholesterol and sterol homeostasis, cellular response to dexamethasone, glucose, glucocorticoid, hexose, monosaccharide, corticosteroid stimulus and nitrogen compound, kidney development (Fig. 5E), while mouse musculus APN + AdipoR2 + IBD targets regulate cellular response to endogenous stimulus, heart, circulatory system, vasculature, tube, animal organ and system development, cell periphery, vascular permeability, enzyme binding, extracellular space (Fig. 5F). APN likely regulate lipids, glucose, sterols, cholesterol, corticosteroids and nitride homeostasis of IBD through AdipoR2 without AdipoR1, thus affecting peripheral systemic development such as heart, kidney, circulatory system, vasculature and vascular permeability.
Canonical and KEGG pathways enrichmentAPN mediates AMPK, HIF-1, PPAR, REG GR, AP1, HDAC, p53 and apelin signaling pathways through AdipoR1 or AdipoR2 to affect IBD progression. Either Homo sapiens (Fig. 5G) or mouse musculus (Fig. 5H) intersection targets of APN + AdipoR1 + AdipoR2 + IBD with APN RS ≥ 10 regulate AMPK, hypoxia-inducible factor 1 (HIF-1) and peroxisome proliferator-activated receptor (PPAR) signaling pathway, diabetic cardiomyopathy, alcoholic liver disease, cholesterol metabolism, glycolysis/ gluconeogenesis, thermogenesis, fat digestion and absorption, ovarian steroidogenesis, malaria, pyruvate metabolism, efferocytosis. Additionally, Homo sapiens APN + AdipoR1 + AdipoR2 + IBD targets are associated with hepatocyte nuclear factor-3beta gene (HNF3B), glucagon, glucocorticoid receptor (REG GR), activator protein 1 transcription factor (AP1) and histone deacetylase (HDAC) class I pathway, lipid and atherosclerosis, type II diabetes mellitus (Fig. 5G), while that of mouse musculus influence glycerolipid, starch, sucrose and fatty acid metabolism, p53 and apelin signaling pathway, insulin secrenion, adherens junction (Fig. 5H). APN regulates cell growth by activating AMPK, suppressing mTOR, increasing p53-p21 axis and activating ribosomal protein S6, thereby reducing protein translation and insulin sensitivity [24]. Either fAPN or gAPN promote tissue proliferation by blocking protein kinase A/C and adenylate cyclase [24]. AMPK, a highly conserved sensor of low intracellular ATP level [39]regulates mitochondrial homeostasis, autophagy, lipid and glucose metabolism by phosphorylating its downstream proteins mTOR, HDAC and PPAR-γ [39,40,41]. APN possibly phosphorylate mTOR and HDAC by activating AMPK and PPAR, which promotes energy metabolism and mitochondrial autophagy during IBD.
APN adjusts PI3K-Akt signaling pathway through AdipoR2 instead of AdipoR1 to influence IBD. Except for the intersection with AdipoR2, the intersection target enrichment of Homo sapiens (Fig. 5I) and mouse musculus (Fig. 5J) APN + AdipoR1 + IBD is only related to pathways in cancer and cytokine-cytokine receptor interaction. Meanwhile, both Homo sapiens (Fig. 5K) and mouse musculus (Fig. 5L) APN + AdipoR2 + IBD intersection target enrichment include hypertrophic cardiomyopathy, cholesterol metabolism, tuberculosis, lysosome and PI3K-Akt signaling pathway. APN regulates cell growth in two ways, one is to inhibit leptin-induced NF-kB-dependent autocrine IL-6 production and trans-IL-6 signaling to pre-neoplastic colon epithelial cells, and the other is to inhibit IL-6-induced cell proliferation by reducing the phosphorylation and activation of STAT-3 in advanced colon cancer cells [24]. APN deficiency activates PI3K-Akt pathway through upstream protein tyrosine kinase Src and IL-6 to inhibit or phosphorylate downstream targets mTOR, resulting in cell survival, growth and cycle in carcinogenesis [42]. APN also reduces TNF-α secreted by macrophage and anti-TNF-α drugs have become clinical drugs for IBD for its activities on inhibit the progression of colitis-related colon cancer [42], so APN and its receptor agonists are expected to become one of clinical treatment strategies for IBD. PI3K-Akt signaling promotes inflammation and induces immune suppression through its downstream genes NF-kB and TNF-α [43]. Therefore, APN may play an anti-inflammatory role in IBD by inhibiting PI3K-Akt pathways and inactivating NF-kB and TNF-α, which delays the progression of IBD.
Molecular DockingIL-6, TNF-α, INS, PPARG, PPARA, CRP, AMPK, PI3Kα and AKT are more likely to interact with AdipoR1/2 than with APN. Intersection targets with APN RS ≥ 10 (Table S2), IBD RS ≥ 50 (Table S10), highest sting node degrees (Fig. 4R-W), significant canonical and KEGG pathways enrichment (Fig. 5G-L) are taken for molecular docking with APN, AdipoR1 and AdipoR2 to explore their affinity. The binding probability and complex stability are evaluated by ZDOCK scores and ΔiG, respectively (Fig. 6A). Whether IL-6, TNF-α, INS, PPARG, PPARA, CRP, AMPK, PI3Kα, AKT interacts with APN and AdipoR/2 has not been specifically reported, so their interaction probability are explored through molecular docking. The spatial structures of TNF-α and CRP are mainly beta sheet (Fig. 6B-C), while IL-6, INS, PPARG PPARA, AMPK, PI3Kα and AKT (Fig. 6D-J) are taken helix structures as principal. ZDOCK scores of IL-6, TNF-α, INS, PPARG, PPARA, CRP, AMPK, PI3Kα and AKT docking with AdipoR1 and AdipoR2 are higher than that of APN (Fig. 6K1-M3, N1-V1 and Figure S19-S45), indicating that AdipoR1/2 had better affinity than APN. APN, a kind of secreted protein, may activate downstream signaling molecules mainly through AdipoR1/2 to regulate various physiological processes. Although the binding interface area of each target and AdipoR1/2 is quite different (Fig. 6K1-M3, N2-V2 and Figure S19-S45), ΔiG< -7.0 kcal/mol (Fig. 6K1-M3, N3-V3 and Figure S19-S45) belonging to stable structures.
Fig. 6
ZDOCK scores, interface area and ΔiG of IL-6, TNF-α, INS, PPARG, PPARA, CRP, AMPK, PI3Kα and AKT respectively docking with APN, AdipoR1 and AdipoR2. (A) summary of molecular docking; (B-J) spatial structure of IL-6, TNF-α, INS, PPARG, PPARA, CRP, AMPK, PI3Kα and AKT; (K1-V1) ZDOCK scores of different factors respectively docking with APN, AdipoR1 and AdipoR2; (J2-U2) interface area of different factors respectively docking with APN, AdipoR1 and AdipoR2; (K3-V3) ΔiG of different factors respectively docking with APN, AdipoR1 and AdipoR2. TOP 1 complex with highest ZDOCK score are analyzed in the figures by molecular docking. ZDOCK is used for molecular docking and PDBePISA is applied to analyze docking results. (B-J) red: secondary structure helix (ss h), yellow: secondary structure beta sheet (ss s), green: secondary structure loop and other structures (ss l+). The PDB ID of APN, AdipoR1 and AdipoR2 used for molecular docking are 6U66, 5LXG and 6KS1. APN: adiponectin; AdipoR1: adiponectin receptor 1; AdipoR2: adiponectin receptor 2; ΔiG: Gibbs free energy. Available (November 2024): https://zdock.wenglab.org/; https://www.ebi.ac.uk/msd-srv/prot_int/
AdipoR1 and AdipoR2 may be complementary in IBD. Although the probability of interaction between APN and IL-6, TNF-α, INS, PPARG, PPARA is lower than that of AdipoR1/2, their interaction areas are larger (Fig. 6K1-M3, N2-R2) and ΔiG is lower than that of AdipoR1/2 (Fig. 6K1-M3, N3-R3). Numbers of hydrogen bonds and salt bridges in APN docking with IL-6, TNF-α, INS, PPARG, PPARA, CRP, AMPK, PI3Kα and AKT are more than that of AdipoR1/2 (Fig. 7A-J), although numbers of disulfide bonds in APN, AdipoR1/2 docking with INS are indistinctive (Fig. 7J). Besides, the sites where APN interacts with IL-6, TNF-α, INS, PPARG, PPARA, CRP, AMPK, PI3Kα and AKT are also diverse (Figure S46-S54). Surprisingly, location and mode of action sites of AdipoR1 and IL-6, TNF-α, INS, PPARG, PPARA, AMPK, PI3Kα, AKT are similar to that of AdipoR2 (Fig. 7L-T). Structure and function of AdipoR1 and AdipoR2 are highly similar, so a feasible complementary effect between AdipoR1 and AdipoR2 may exist in IBD. The dual agonist of AdipoR1/2 enhances mitochondrial function by activating AMPK [44]PI3K-AKT [45] and PPARG signaling pathways [46]also indicating that physiological functions of AdipoR1 and AdipoR2 are complementary rather than contradictory.
Fig. 7
Amino acid sites of AdipoR1 and AdipoR2 interacts with different factors. (A) summary and predication of molecular docking; (B-K) numbers of hydrogen bonds, salt bridges and disulfide bonds of APN, AdipoR1/R2 docking with IL-6, TNF-α, INS, PPARG, PPARA, CRP, AMPK, PI3Kα and AKT; (L1-T1) IL-6, TNF-α, INS, PPARG, PPARA, CRP, AMPK, PI3Kα and AKT respectively docking with AdipoR1; (L2-T2) IL-6, TNF-α, INS, PPARG, PPARA, CRP, AMPK, PI3Kα and AKT respectively docking with AdipoR2. APN: adiponectin; AdipoR1: adiponectin receptor 1; AdipoR2: adiponectin receptor 2; IL-6: interleukin-6; TNF-α: tumor necrosis factor α; INS: insulin; PPARG: peroxisome proliferator-activated receptor gamma; PPARA: peroxisome proliferator-activated receptor alpha; CRP: C-reactive protein; AMPK: adenosine 5’-monophosphate (AMP)-activated protein kinase; PI3Kα: phosphatidylinositol 3-kinase α; AKT: protein kinase B. Available (November 2024): https://zdock.wenglab.org/; https://www.ebi.ac.uk/msd-srv/prot_int/
TNF-α, AMPK may interact directly with AdipoR1. TOP 1 complex ZDOCK score of TNF-α (2349.537, Fig. 6L1 and 6O1) and AMPK (2403.677, Fig. 6L1 and 6T1) docking with AdopoR1 are higher than that of APN (2099.047, Fig. 3B), so they possess a high probability of interacting directly with AdopoR1. ZDOCK score of TNF-α docking with AdipoR1/2 is higher than that of other targets, possibly resulting from the high structural similarity between TNF-α and APN [24,25,26]. Meanwhile, TOP 1 complex ZDOCK score of TNF-α (2349.537, 2496.633), INS (2032.676, 2083.85), PPARG (2138.129), PPARA (2068.198, 2196.308), CRP (2135.607, 2119.811), AMPK (2403.677, 2342.974), PI3Kα (2299.148, 2281.81), AKT (2099.047, 2078.764) docking with AdipoR1/2 (Fig. 6L1-V1) are close to that of APN (2303.998, 2535.086, Fig. 3B-C), indicating that they have possibility of direct interaction with AdipoR1/2.
AdipoR1 and AdipoR2 interact directly with APPL1 to mediate AMPK, PPARA, PI3K-AKT, p38-MAPK, IRS1/2 signaling pathway. APN binds to its receptor AdipoR1/2 and mediates the direct interaction between AdipoR1/2 and pleckstrin homology domain, phosphotyrosine binding domain, and leucine zipper motif 1 (APPL1), which regulates the downstream AMPK, PPARA, PI3K-AKT, p38 MAPK, insulin receptor susbstrate-1/2 (IRS1/2) signaling pathway [47]. TOP 1 complex ZDOCK scores of APPL1 docking with APN, AdipoR1/2 are AdipoR2 > AdipoR1 > APN (Figure S55-S58), and their complex structure are stable (ΔiG< -7.0 kcal/mol, Figure S55D) in spite of interface areas of APPL1 docking with AdipoR1/2 are small (Figure S55C-G). Additionally, the affinity of APPL1 to AdipoR2 (ZDOCK score = 3193.088) is higher than AdipoR1 (ZDOCK score = 2779.741).
Comments (0)