Cell source and culture medium
The GH3 and MMQ cell lines were obtained from the American Type Culture Collection (Manassas, VA, USA) and cultured in 75-cm2 cell culture flasks. The MMQ and GH3 cell lines were derived from rat pituitary tumors. The cells were maintained in DMEM (high glucose with pyruvate, L-glutamine, Meilunbio, Dalian, China) supplemented with 10% fetal bovine serum (Gibco, Grand Island, NY, USA). The cultures were incubated at 37 °C in an atmosphere with 5% CO2 and 95% air. The medium was changed every two days. To maintain stable cellular characteristics, all cell lines used in the experiments were maintained within 20 passages.
Primary pituitary tumor cells were isolated from surgical samples obtained from patients with DA-resistant prolactinomas at Beijing Tiantan Hospital. The patients provided informed consent, and the study protocol followed the ethical guidelines outlined in the Declaration of Helsinki; the study was approved by the Ethics Review Board of Beijing Tiantan Hospital on August 16, 2024 (Approval No. KY2024-227-01). Fresh tumor tissues collected during surgery were immediately stored in a tissue preservation solution (130100008, Miltenyi Biotec, Bergisch Gladbach, Germany) and transported to the laboratory for further processing. The tissue was mechanically dismantled using sterile instruments in a digestive enzyme mixture (12605028, Thermo Fisher Scientific, Waltham, MA, USA.) until the major tissues were no longer visible. The solution was then filtered through a 40 μm cell strainer (BS-40-CS, Biosharp, Hefei, China), which was repeated three times. The filtered liquid was mixed with erythrocyte lysate (R1010, Solarbio, Beijing, China) at a 1:1 ratio and incubated on ice for 10 min. After lysis, the tumor cells were collected via centrifugation, the yield of primary cells is approximately 0.75 × 10⁷ to 1 × 10⁷ cells per gram of tissue sample. Primary cells were nurtured in DMEM (low glucose with pyruvate, L-glutamine, Meilunbio) supplemented with 10% fetal bovine serum (Gibco, Grand Island, NY, USA) and growth factor and cultivated in the same environment as previously mentioned.
Reagent acquisition and configuration
Deguelin, putrescine, and SC-79 were purchased from MedChemExpress (MCE, Monmouth Junction, NJ, USA). To prepare stock solutions, deguelin and SC-79 were dissolved in DMSO (MCE) at 10 mM. Putrescine was dissolved in a sterile GH3 medium and prepared as a stock solution at 100 mM. All reagents were stored at −80 °C following the manufacturer’s guidelines.
Cell viability assay
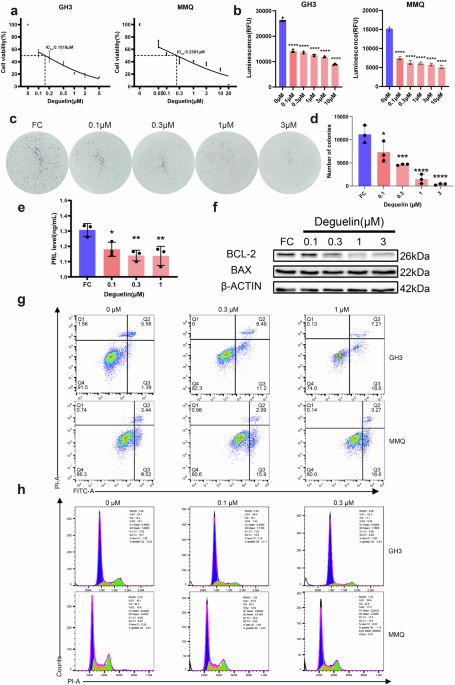
The CCK-8 assay was conducted to evaluate cell proliferation. Briefly, 20,000 cells were plated in 96-well plates, with 100 μL of the corresponding medium added to each well. After exposure for 48 h to various concentrations of deguelin (for supplemental rescue experiments, different concentrations of putrescine and SC-79 were added), 10 μL of CCK-8 (BS350A, Biosharp, Hefei, China) was added to the cells in each group. After 2 h of culture, optical density (OD) was measured at 450 nm, and cell viability was calculated as follows:
$$\frac}_}}}}-}_}}}}}}_}}}}-}_}}}}}\times 100 \%$$
ODEG, the optical density of cells in the experimental group at 450 nm;
ODCG, the optical density of cells in the control group at 450 nm;
ODBlank, the optical density of the blank well at 450 nm.
A CellTiter-Glo® (CTG) assay was also conducted to measure cell viability (G7572, Promega, Madison, WI, USA). According to the protocol, premixed CellTiter-Glo® Reagent was added to the experimental, control, and blank wells. After 2 min of rapid shaking and 5 min of incubation at room temperature, luminescence was measured. Finally, the 96-well plates were evaluated using a microplate reader.
PRL enzyme-linked immunosorbent assay (ELISA)
To investigate the effect of deguelin on PRL secretion, cell culture supernatants or animal serum were collected, and the PRL levels were quantified using a PRL ELISA Kit (CUSABIO, E06881r, China) following the protocol provided with the kit. The sensitivity of the PRL ELISA Kit was 0.125 ng/mL, with a measurement range spanning from 0.125 ng/mL to 50 ng/mL.
Flow cytometry
To evaluate the effect of deguelin on the cell cycle and apoptosis, GH3 and MMQ cells were exposed to deguelin as described earlier and then harvested and stained following the protocol provided with the Cell Cycle Kit (#CA1510, Solarbio, Beijing, China) and FITC Annexin V Apoptosis Detection Kit I (556547, BD Biosciences, San Jose, CA, USA). The results were analyzed by flow cytometry (Amnis® ImageStream®X MK II, Cytek, Fremont, CA, USA), and the results were processed using IDEAS application v6.2 software.
Prediction of deguelin targets
The Swiss Target Prediction database [18] (http://swisstargetprediction.ch/, accessed on 6 March 2024) was used, with the species designated “Homo sapiens” and a screening condition of probability >0 used to process the results. The web interface of the similarity ensemble approach (SEA) [19] (https://sea.bkslab.org/, accessed on 6 March 2024) was also used for target prediction. CB-Dock2 was used for blind docking, with the number of cavities for docking = 10 [20] (https://cadd.labshare.cn/cb-dock2/index.php, accessed on 1 April 2024).
Targeted metabolomics
The cell samples were treated with 500 μL of 80% methanol. After centrifugation (15,000 × g, 4 °C, 15 min), the resulting mixture was evaporated with nitrogen to yield a dry residue. The dried residue was derivatized at room temperature for 10 min by adding 50 μL of sodium carbonate and 2% benzoyl chloride. The samples were then combined in equal proportions to create a quality control sample. MS analysis was conducted using an Agilent UHPLC system (1290 Infinity II) coupled with a triple quadrupole mass spectrometer (6470 A, Santa Clara, CA, USA). The Agilent MassHunter software (B.08.00, Agilent Technologies, Santa Clara, CA, USA) was used to acquire the data.
Ornithine decarboxylase (ODC) activity measurement
In total, 1 × 10⁶ GH3 cells were exposed to deguelin at concentrations of 0, 0.1, 0.3, 1, or 3 mM for 48 h in triplicate. After digesting the cells with trypsin, they were collected to measure ODC activity using a kit (MC156L, Mlbio, China). The fundamental principle of the kit is based on the catalysis of ODC, which mediates the conversion of the substrate ornithine into the product putrescine. Following the termination of catalysis, the substrate putrescine was derivatized using a specific derivatizing agent. The derivative formed exhibited the highest absorption peak at 254 nm, allowing the magnitude of the ODC enzyme activity to be determined by measuring the change in the absorbance value at this wavelength.
Surface plasmon resonance (SPR)
Recombinant ODC1 (HY-P71109, MCE, Monmouth Junction, NJ, USA) was immobilized onto a CM5 chip (#BR100530, Cytiva, Marlborough, MA, USA) using the carboxyl groups on the dextran surface. After incubation, different concentrations of L-ornithine and deguelin were separately passed through the protein-CM5 system. Competition experiments were performed using the ABA injection method with deguelin at 10 μM and L-ornithine at 1 μM to test the affinity of the human ODC1 protein for the compound L-ornithine in the presence of deguelin. The binding was tested and analyzed using a Biacore T200 instrument.
Bulk RNA-seq and analysis
A total of 500,000 GH3 cells were exposed to deguelin at concentrations of 0, 0.1, 0.3, and 1 mM for 48 h, with six biological replicates; then, the cells were collected for RNA sequencing. Briefly, TRIzol (DP424, TIANGEN, Beijing, China) was used to extract total RNA, and its integrity was evaluated using a Bioanalyzer (2100, Agilent Technologies, Santa Clara, CA, USA). Next, mRNA was purified using magnetic beads attached to poly-T. Reverse transcription of the fragmented mRNA was performed using random primers to obtain cDNA for constructing a library. A Qubit 2.0 fluorometer (Thermo Fisher Scientific, Waltham, MA, USA) was used to quantify the initial concentrations, and an Agilent 2100 bioanalyzer was used to assess library fragment size. After meeting expectations, qRT-PCR was performed to quantify the effective concentration of the libraries and ensure their quality. The clustering of the index-coded samples was performed on a cBot Cluster Generation System using the TruSeq PE Cluster Kit v3-cBot-HS (Illumina, San Diego, CA, USA) and then sequenced on the Illumina NovaSeq platform. The data were aligned to the reference genome using HISAT2, as recommended. The gene expression level was quantified, and differential genes were identified using the featureCounts and DESeq2 R packages, applying thresholds of padj ≤ 0.05 and |log2(foldchange)| ≥ 1. Gene Ontology (GO) enrichment and Kyoto Encyclopedia of Genes and Genomes (KEGG) enrichment were subsequently performed using the ClusterProfiler R package, following the provided guidelines.
Vector construction and transfection
The shCREB3L1 plasmid was obtained from GeneChem (Shanghai, China), with the sequence for CREB3L1 knockdown being 5′-GCCACTGCTCTTGACAGAAGA-3′. The CREB3L1 overexpression plasmid was also constructed by GeneChem. Next, Lipofectamine 3000 transfection reagent (Thermo Fisher Scientific, Waltham, MA, USA) was used for transfection, following the manufacturer’s instructions.
Western blotting and antibodies
Protein samples were separated on 10% Bis-Tris SDS-PAGE gels and then transferred to PVDF membranes (Merck, Darmstadt, Germany). Primary and secondary antibodies were diluted in a Tris-buffered saline solution with 0.1% Tween-20 (TBST), to which 1% bovine serum albumin was added. The target protein bands were detected via chemiluminescence detection. The following antibodies were used in this study: CREB3L1 (PA5-113298, 1/2000) was obtained from Thermo Fisher Scientific, Waltham, MA, USA. PIT-1 (ab273048, 1/1000) and PRL (ab188229, 1/2000) antibodies were purchased from Abcam, Cambridge, UK. We purchased pP38 (4511T, 1/1000), P38 (8690P, 1/1000), pP65 (3033T, 1/1000), P65 (8242T, 1/1000), pAKT (4060S, 1/2000), AKT (4691S, 1/1000), pErk1/2 (4695S, 1/1000), Erk1/2 (4370S, 1/2000), and PI3K-100α (4249S, 1/1000) from Cell Signaling Technology, Danvers, MA, USA. BCL-2 (YM3041, 1/2000) and BAX (YT0459, 1/1000) were purchased from Immunoway, Plano, TX, USA. The internal reference antibodies GAPDH (60004–1-lg) and β-ACTIN (66009–1-Ig) were purchased from Proteintech, Wuhan, China. Anti-rabbit antibodies (ZB-2301) and anti-mouse antibodies (ZB-2305) were purchased from ZSGB-BIO, Beijing, China and used as secondary antibodies.
Active Rac1 pull-down
To determine whether deguelin treatment affects RAC1 activation and if putrescine supplementation could rescue this effect, we performed a RAC1-GTP pull-down assay (Kit P2439S, Beyotime, Shanghai, China) using the p21-binding domain (PBD) of PAK1. Briefly, cell lysates (using GTPγS/GDP-loaded lysates as controls) from treated groups were incubated with PBD-conjugated beads at 4 °C for 3 h. After centrifugation to remove unbound proteins, the bound complexes were eluted with 1× SDS-PAGE loading buffer by heating at 95 °C for 5 min, followed by Western blot analysis.
Xenograft experiments
All experimental procedures were conducted in accordance with protocols authorized by the Institutional Animal Care and Use Committee at Beijing Neurosurgical Institute (Approval No. BNI202307005). Care was taken to reduce animal utilization and alleviate potential distress throughout the study. Ten female BALB/c nude mice (4 weeks old) were acquired from Beijing Vital River Laboratory Animal Technology and housed in specific pathogen-free conditions at Beijing Neurosurgical Institute. The facility maintained a 12 h light/dark cycle (lights activated at 08:00) with ad libitum access to feed and water. Environmental parameters were regulated at 27 ± 1 °C with relative humidity maintained between 40% and 60%.
Following a 7-day acclimation period, the mice (n = 10) were randomly allocated into treatment and control groups (n = 5 per group). All subjects received subcutaneous inoculations of 1.6 × 10⁶ GH3 cells suspended in serum-free medium at the right flank. After 7 days post-implantation, the treatment group received intraperitoneal administrations of deguelin (4 mg/kg) three times weekly, while control animals received equivalent volumes of saline solution at the same frequency for 3 weeks. Terminal euthanasia was performed 4 weeks post-cell injection, whereupon tumor dimensions and mass were systematically determined. Excised neoplastic tissues were bisected for parallel preservation through either 4% paraformaldehyde fixation or snap-freezing in liquid nitrogen for subsequent analyses.
Immunohistochemistry techniques
Tumor tissue samples preserved in formaldehyde were processed through paraffin embedding and analyzed via immunohistochemical (IHC) staining procedures. The automated staining process was conducted using the Leica BOND-III platform, a continuous-access slide processing instrument manufactured in Nussloch, Germany. For primary antibody visualization, the Bond Polymer Refine Detection kit (Leica Biosystems, Nussloch, Germany) was implemented according to manufacturer specifications. Digital image acquisition and analysis were performed using the Aperio AT2 high-throughput scanning system (Leica Biosystems).
Immunoreactivity was quantitatively assessed through a four-tier classification system based on staining intensity: negative (0), weak (1+), moderate (2+), and strong (3+). Quantitative evaluation of immunopositivity was conducted through systematic calculation of H-scores, determined as follows:
$$}}}-}}}=\left(0\times _\right)+\left(1\times _\right)+\left(2\times _\right)+\left(3\times _\right)$$
P0: Percentage of cells with negative staining intensity relative to total cell count;
P1: Percentage of cells with weak staining intensity relative to total cell count;
P2: Percentage of cells with moderate staining intensity relative to total cell count;
P3: Percentage of cells with strong staining intensity relative to total cell count.
The range of H-score 0 to 300, corresponding to 100% of cells stained with negative to strong intensity. The intensity of positive staining was determined automatically using Qupath software (version 0.5.0).
Hematoxylin-eosin (H&E) staining
H&E staining was performed on paraffin-embedded organ sections to evaluate deguelin toxicity. Briefly, deparaffinized sections were stained with hematoxylin for 1.5 min, washed, and differentiated in 1% acid alcohol. After rinsing, sections were counterstained with 0.5% eosin for 1 min, followed by standard dehydration. Slides were mounted with neutral resin and digitally scanned using an Aperio AT2 high-throughput scanning system (Leica Biosystems) for analysis.
Statistical analysis
The data were expressed as the mean ± standard deviation (SD) of more than three independent experiments. The Shapiro–Wilk test was conducted to determine whether the data followed a normal distribution. Student’s t-test was conducted for two-group comparisons, and one-way ANOVA was conducted for comparisons involving three or more groups, followed by Dunnett’s multiple comparison test for post hoc analysis. All results were considered to be statistically significant at P < 0.05. The GraphPad Prism software (version 10.1.2) was used to conduct all statistical analyses.

Comments (0)